Application of prior knowlege models
and interactive data analysis in spectrIm-QMRS
On this web page we will demonstrate how a "previously defined prior knowledge models can be applied to the Siemens example DICOM-dataset which can be downloaded on this website, namely here.
Lets assume that you made a new prior knowledge model, and you just returned to the main GUI of spectrIm-QMRS. In order to make your previously made model the "default model" within the GUI press the refresh button as indicated below:

After having pressed this model all toolbar dropdown boxes are updated, and the currently selected model appears as is indicated here:
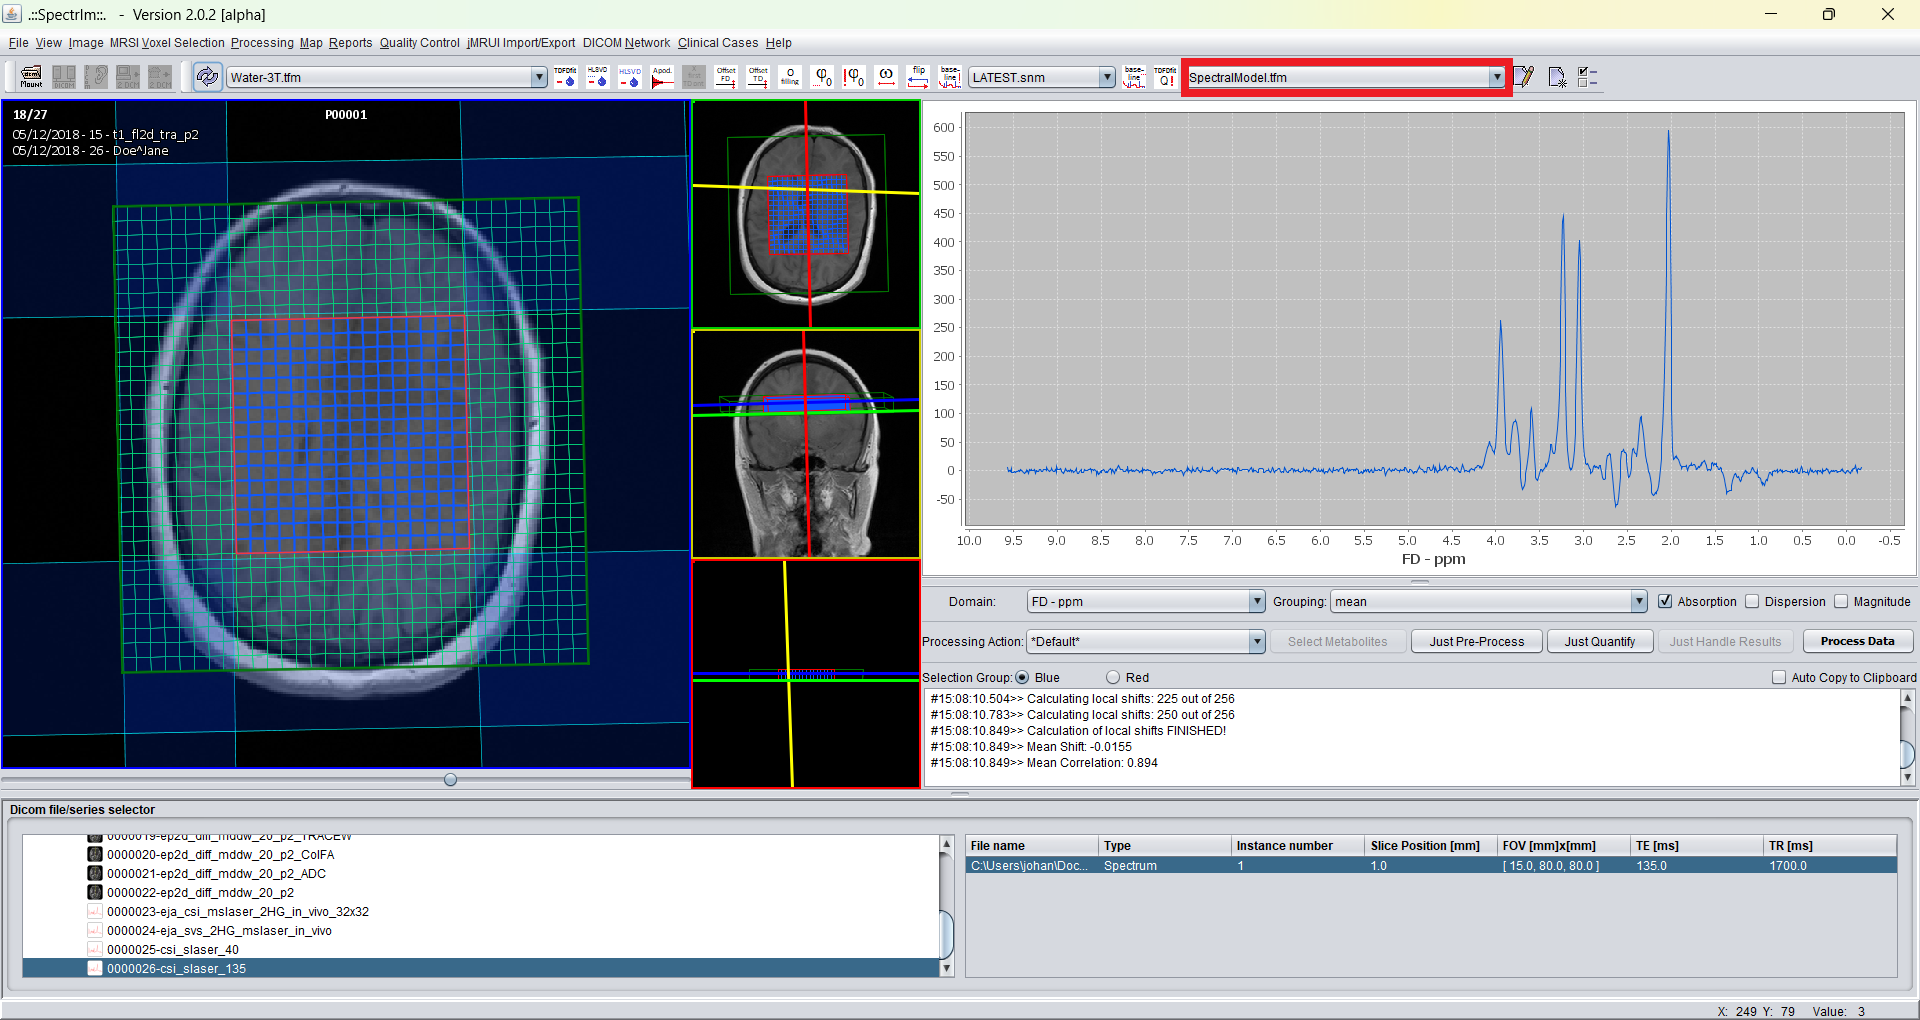
The default model is "SpectralModel.tfm". Now to apply this model to the selected voxels of this 2D-MRSI-dataset (blue marked voxels) by simply pressing the "TDFDFit !Q" menubar button:
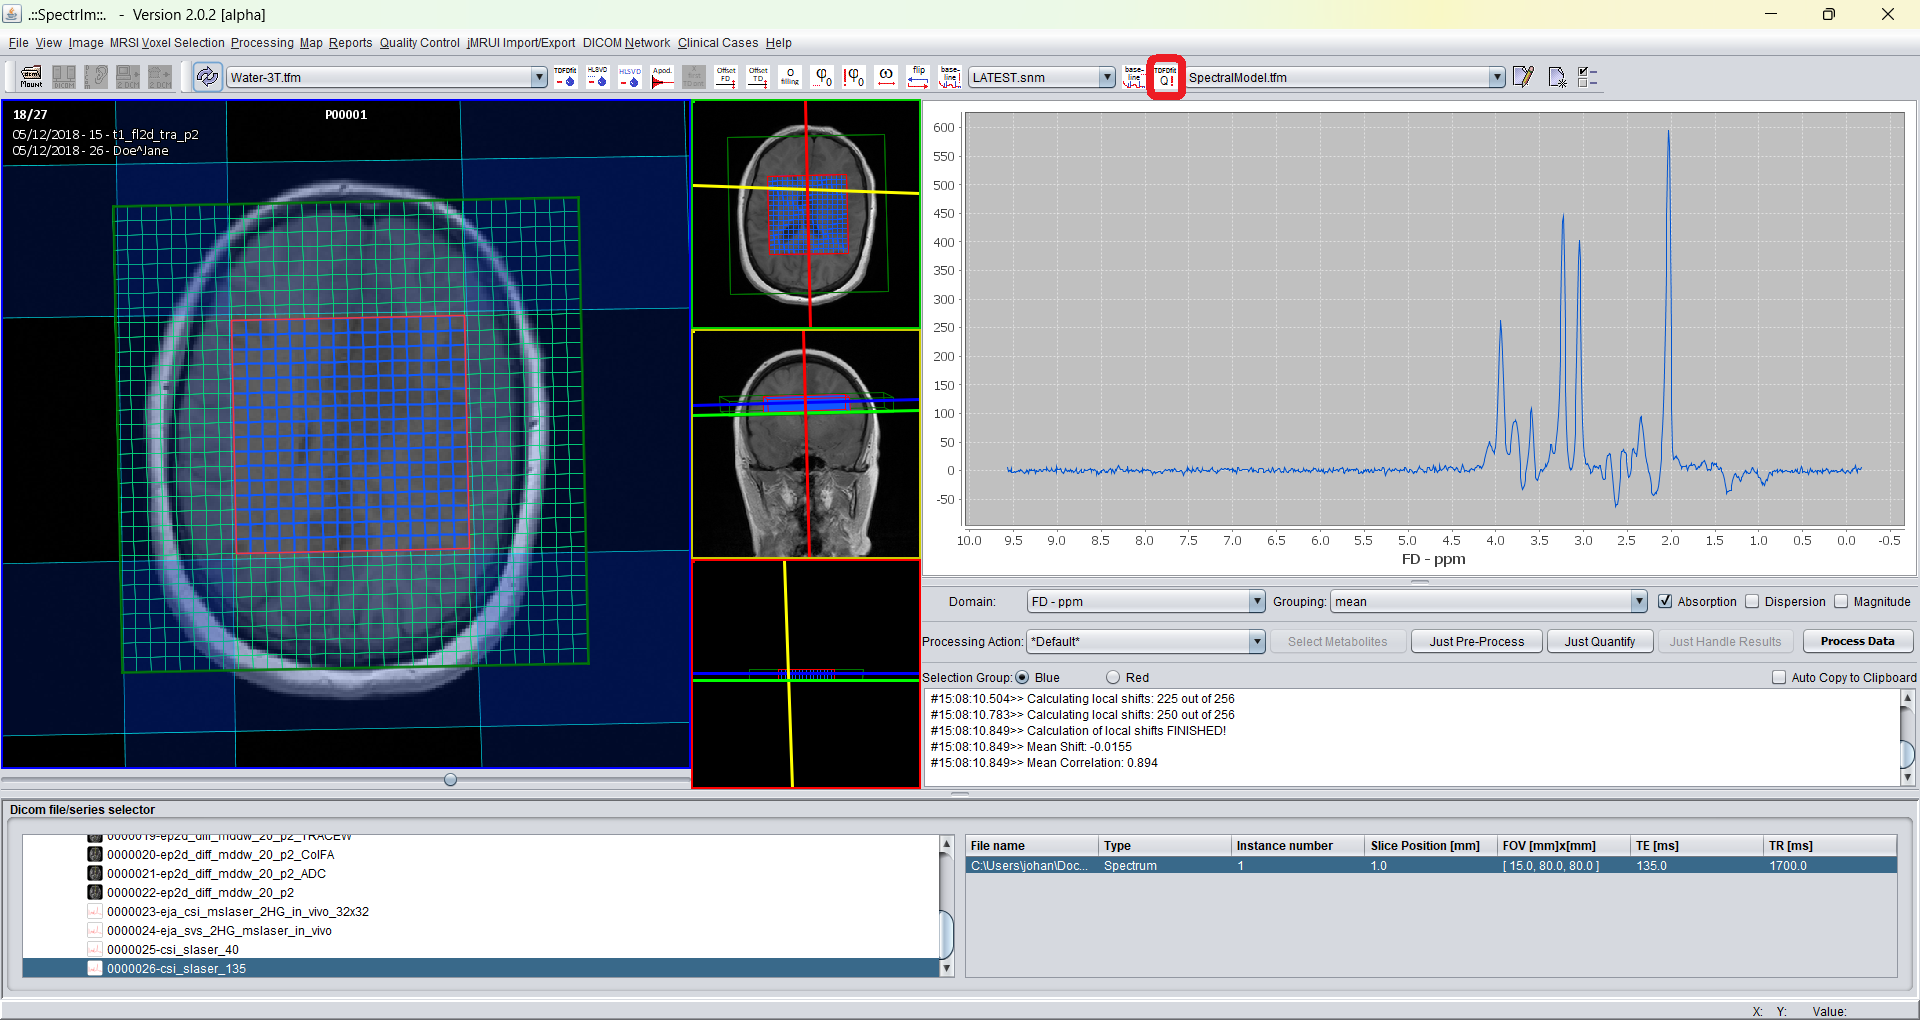
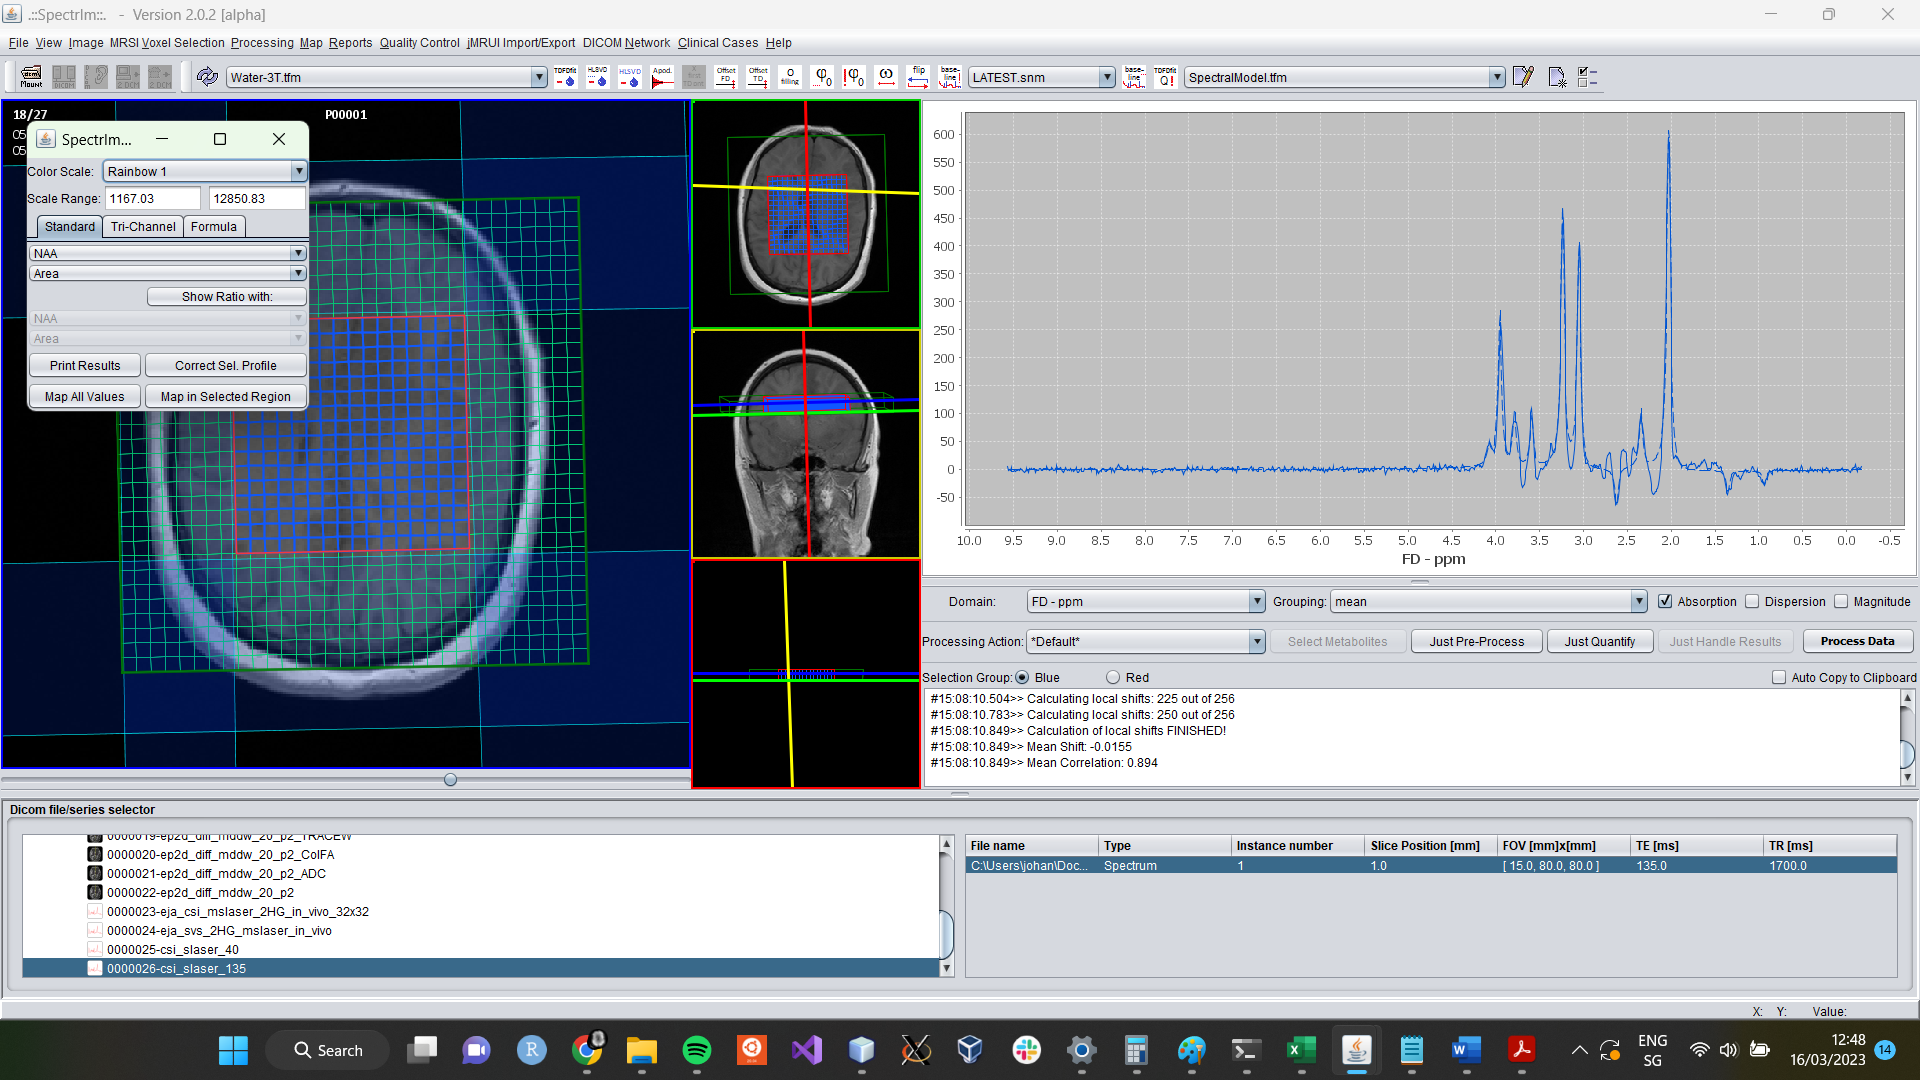
During the TDFDFit process the GUI looks like following:
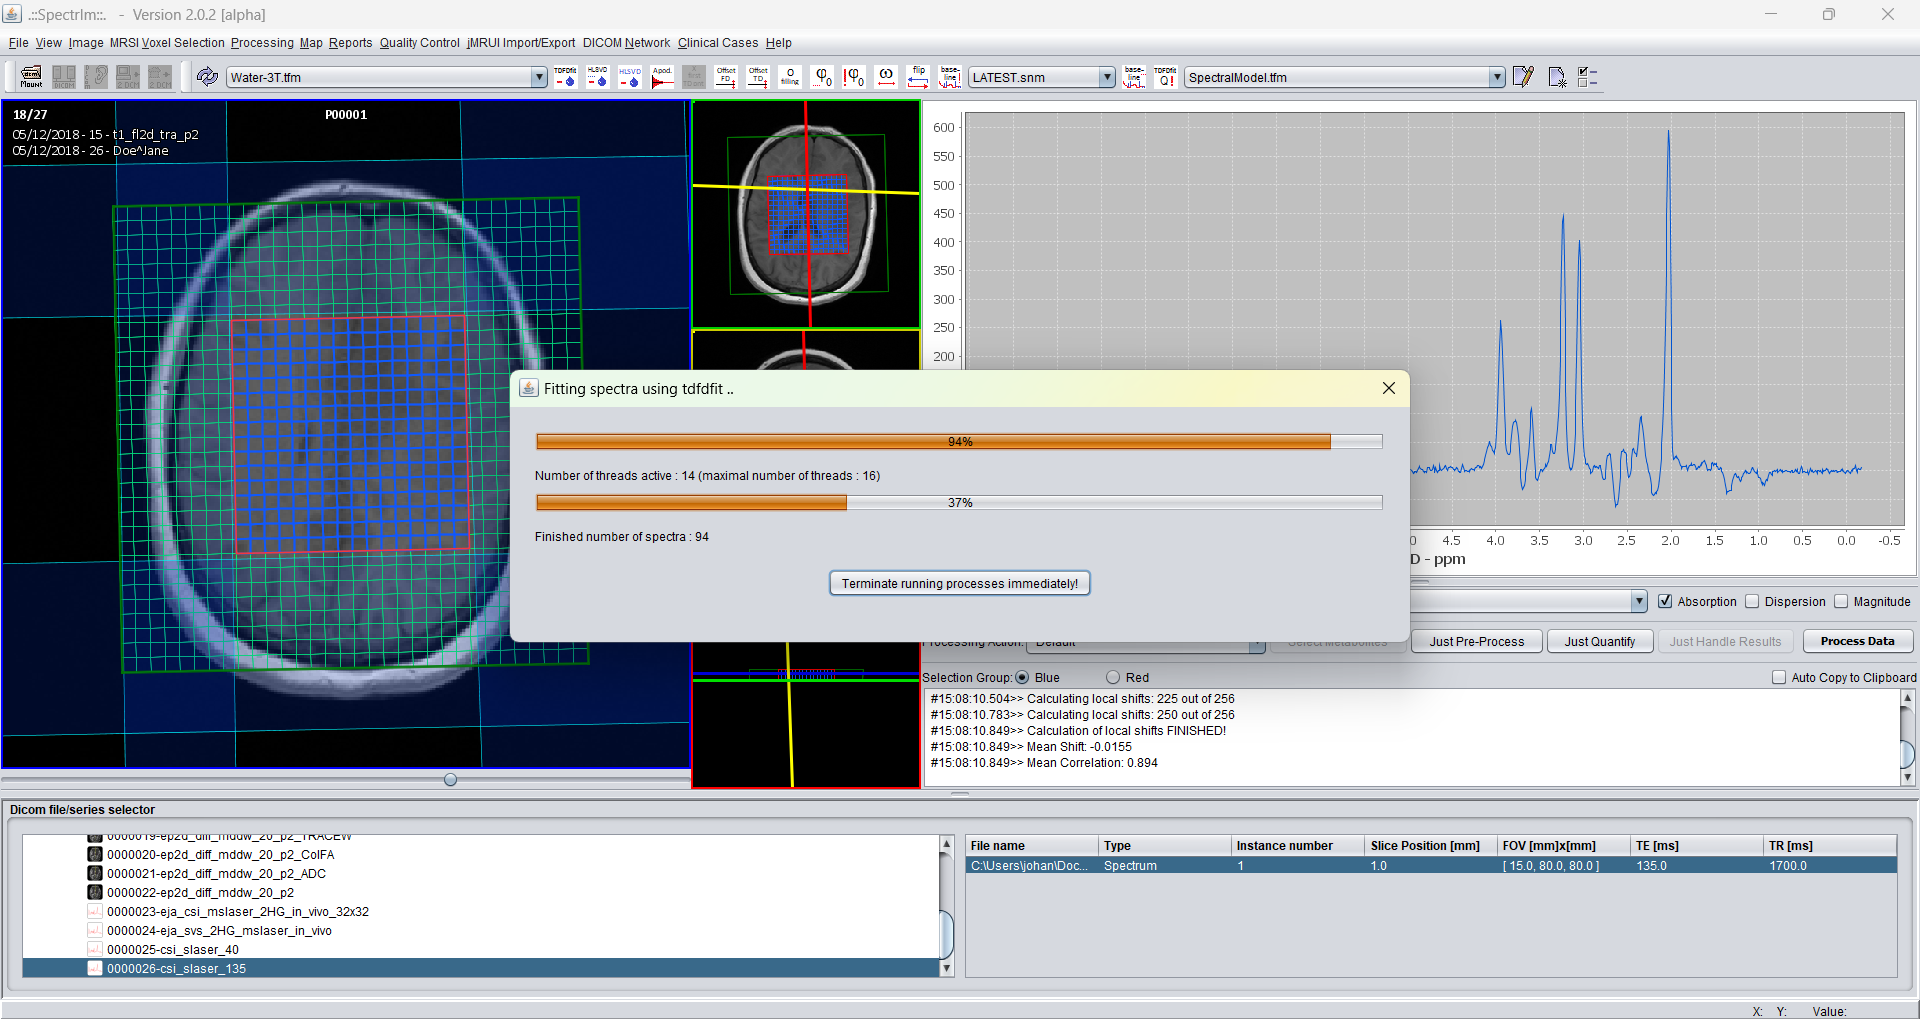
A progressbar is shown during the fitting of the data. The upper progressbar shows how much active threads are being performed, the lower progressbar indicates the percentage of the total quantification steps have been performed in the meantime.
The quantification is performed on the CPU of the computer.
The fitting of the spectra occurs by multiple system calls, having at maximum 2*N-1 independent threads running, with N is the number of cores of the computers CPU.
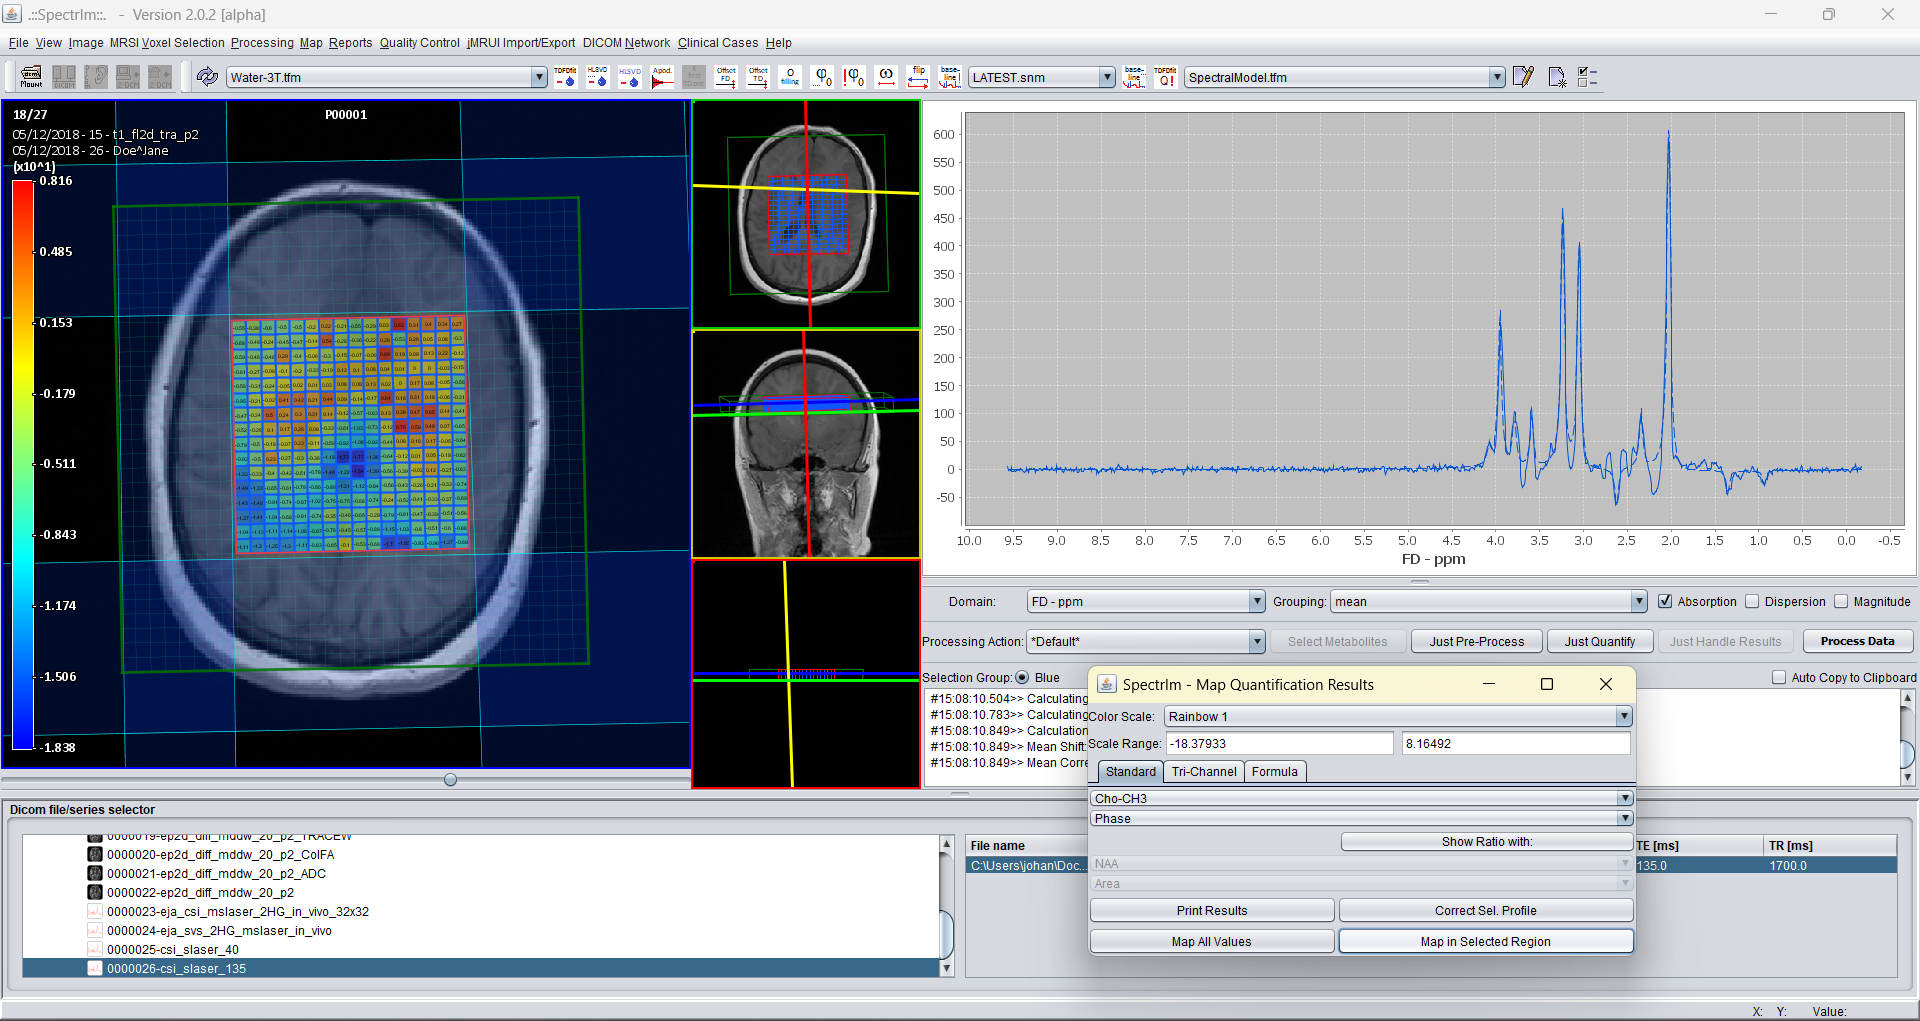
After all selected spectra have been fitted, the application have collected all the fitting information, and the sum of all fitted spectra is overlaid in a dashed blue line over the sum of the measured spectra in the spectrum viewer GUI of spectrIm-QMRS:
Analysis of fitting results
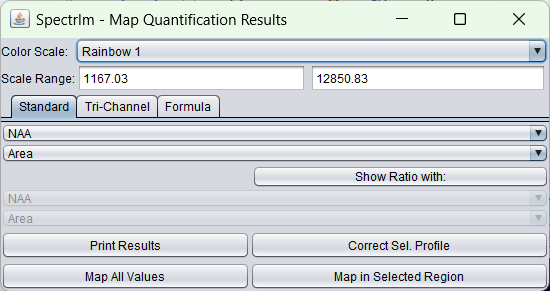
The little window that pops-up after the fit, enables the very easy creation and display of metabolite maps. The horizontally zoomed popup window looks the following:
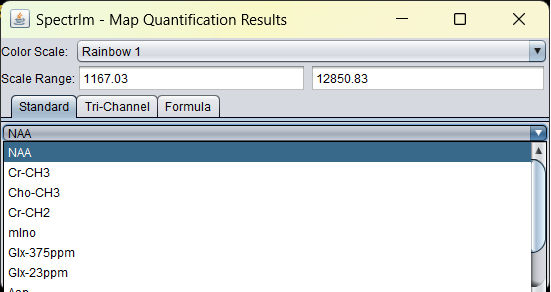
In the upper dropdown list, a list of all spectral components of the model can be found:
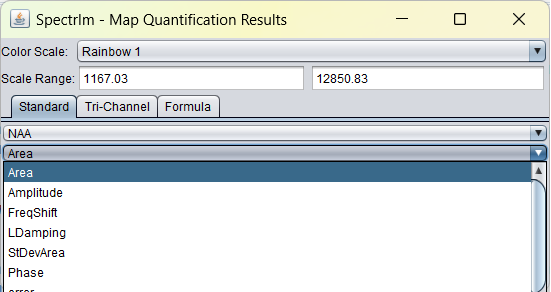
In the dropdown list below, a list of all parameter types that are fitted are listed:
Creation of metabolite maps from fitted spectra
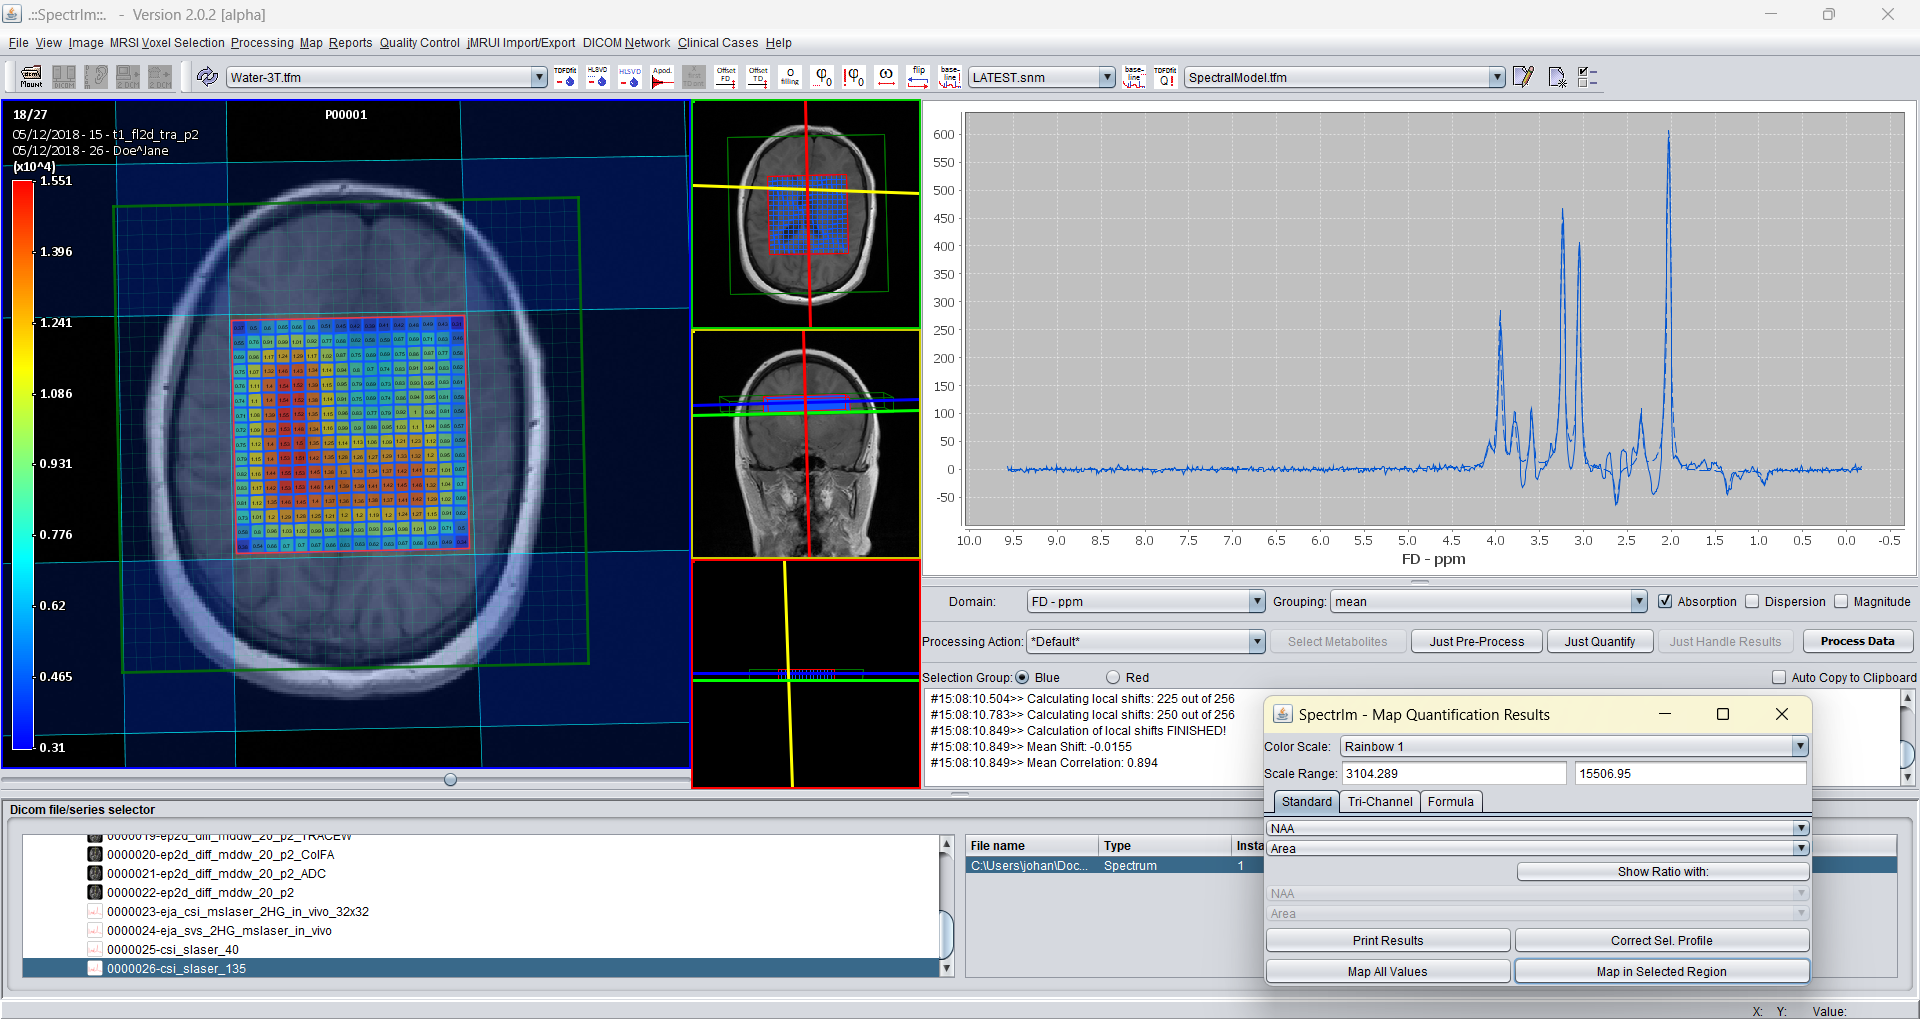
If the metabolite NAA is selected in the upper dropdown list, and in the secod dropdown list the "Area" button, spectrIm-QMRS will show the following:
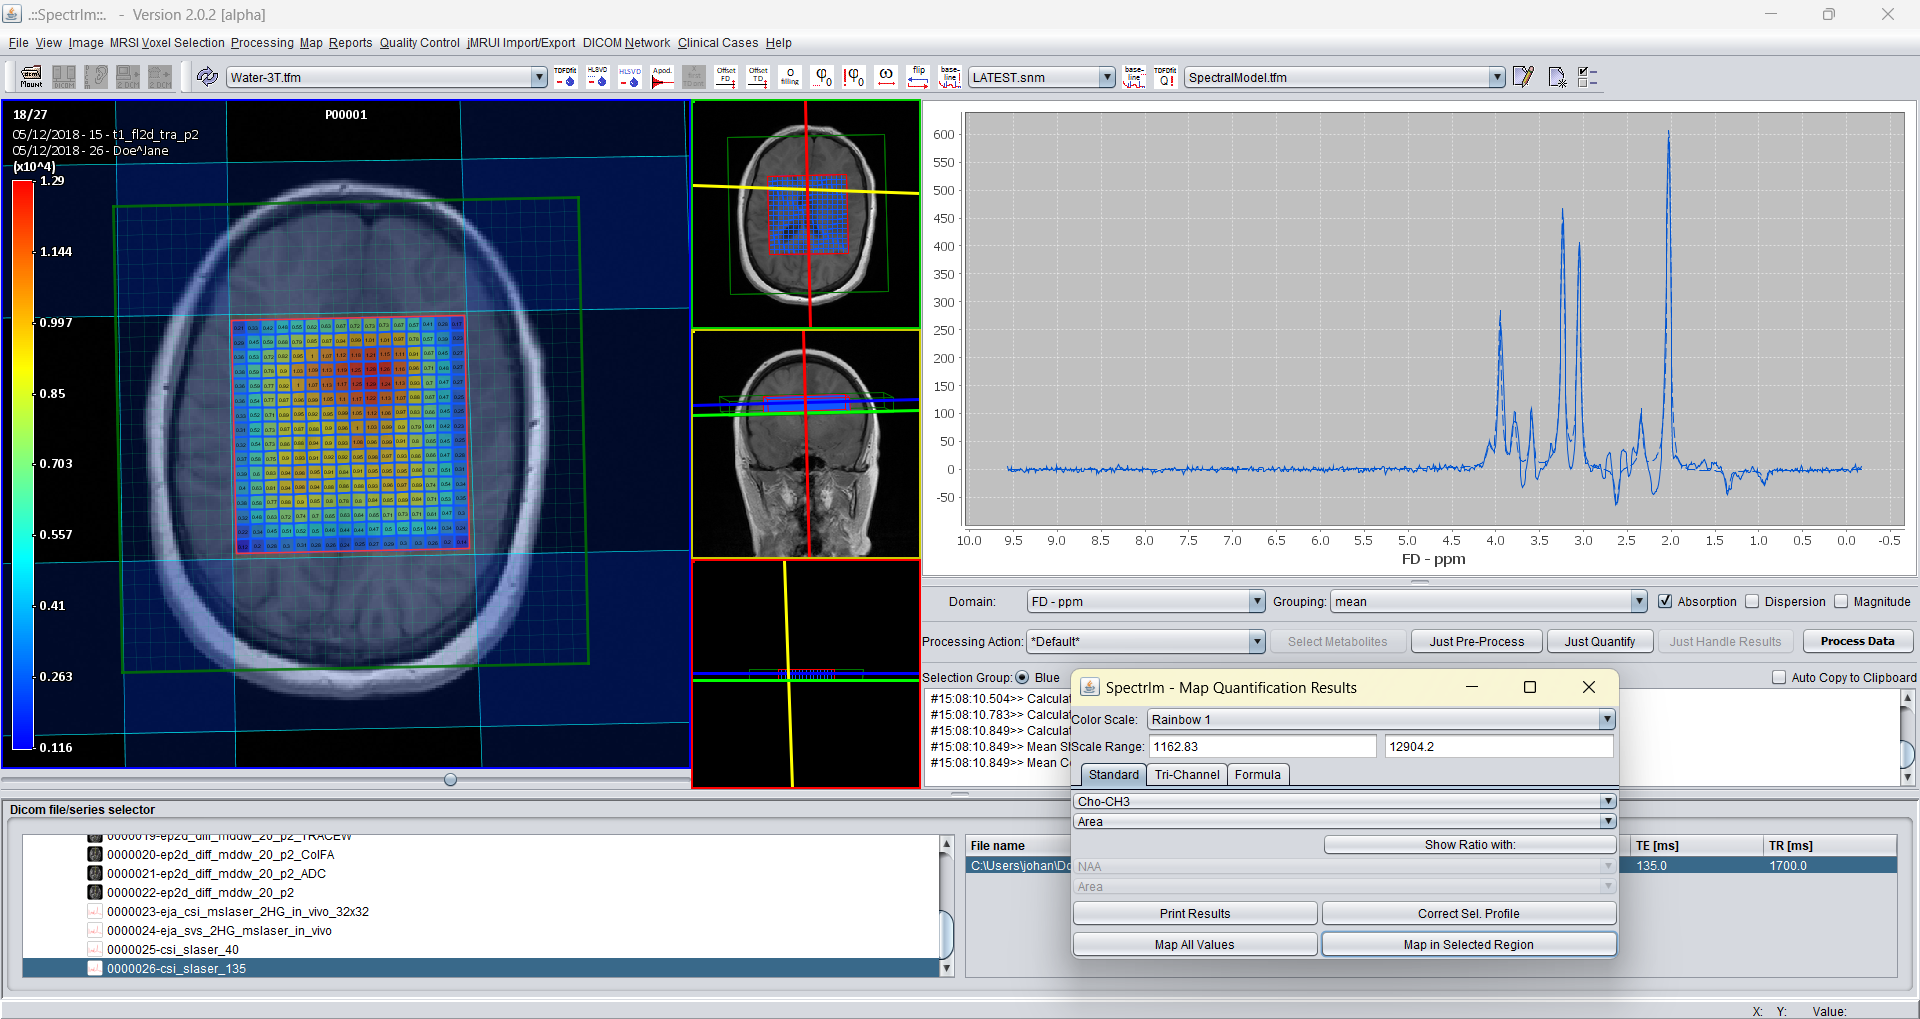
And the Cho-CH3 peak area map:
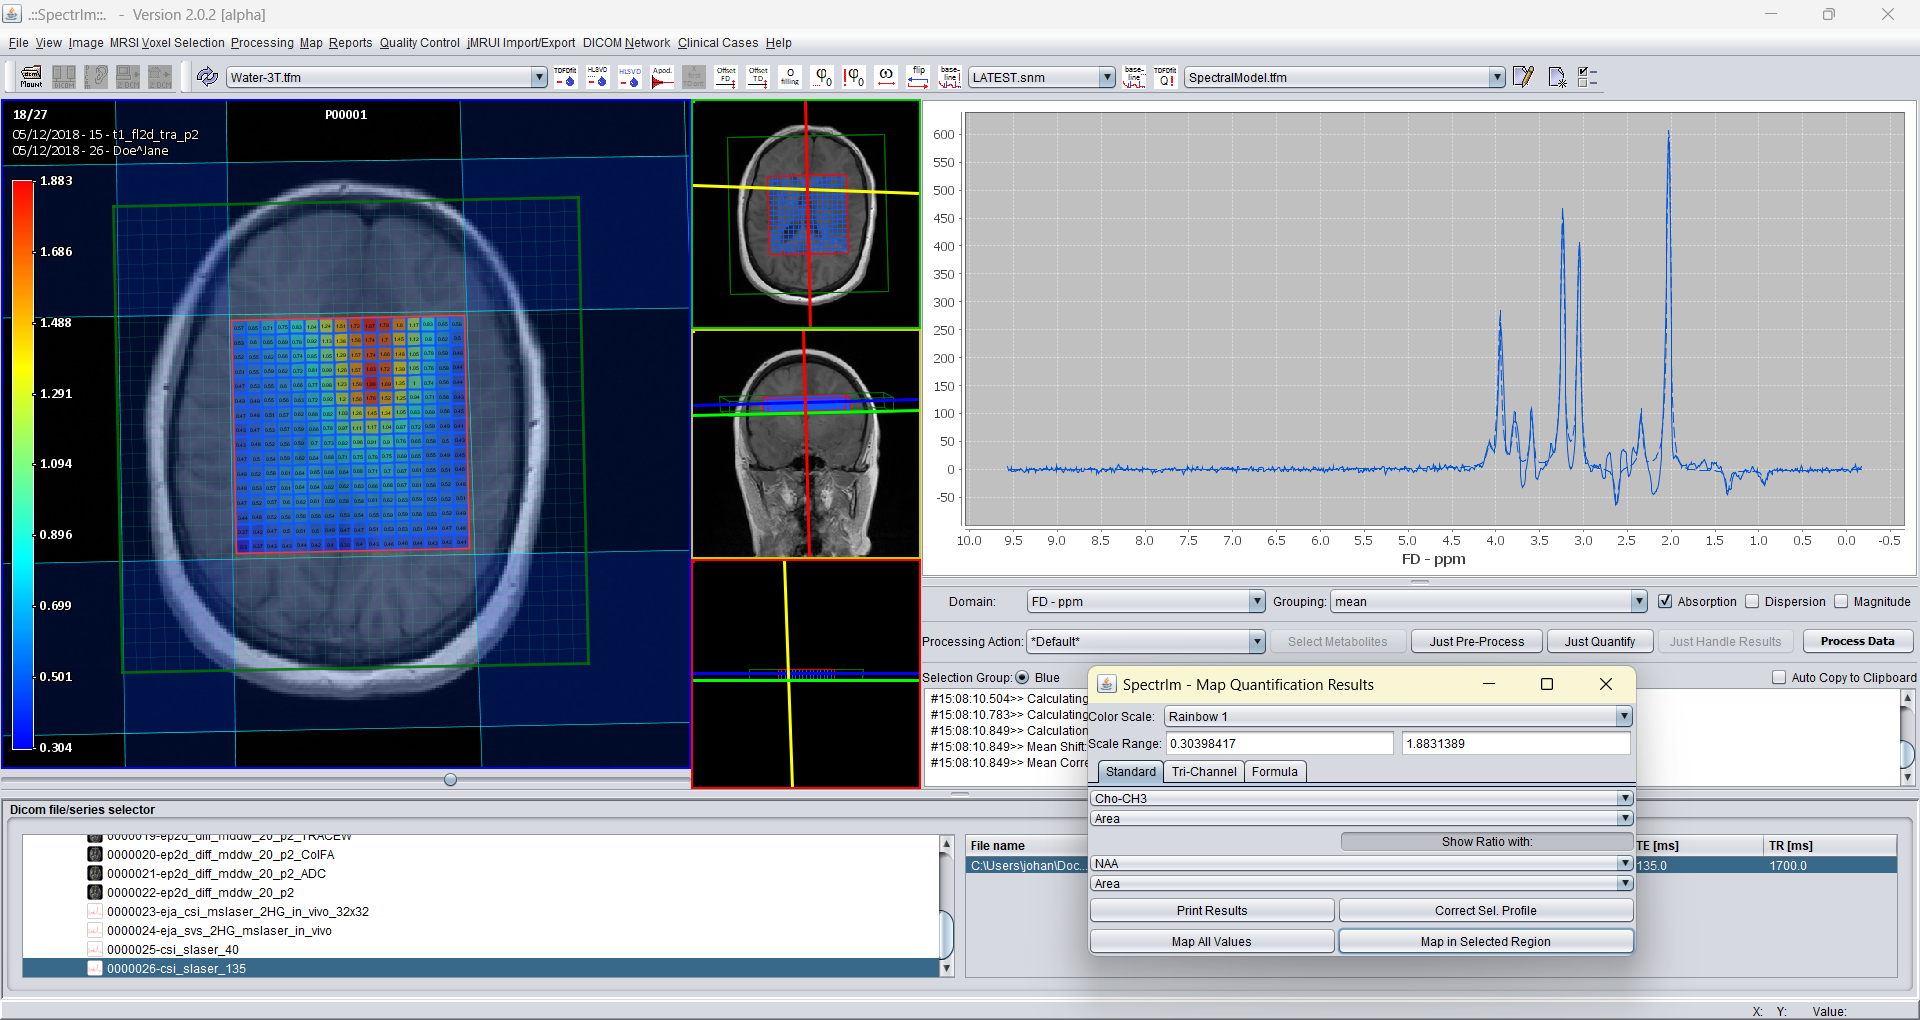
Also peakarea ratio mapsare possible; e.g. Cho-CH3/NAA -ratio map:
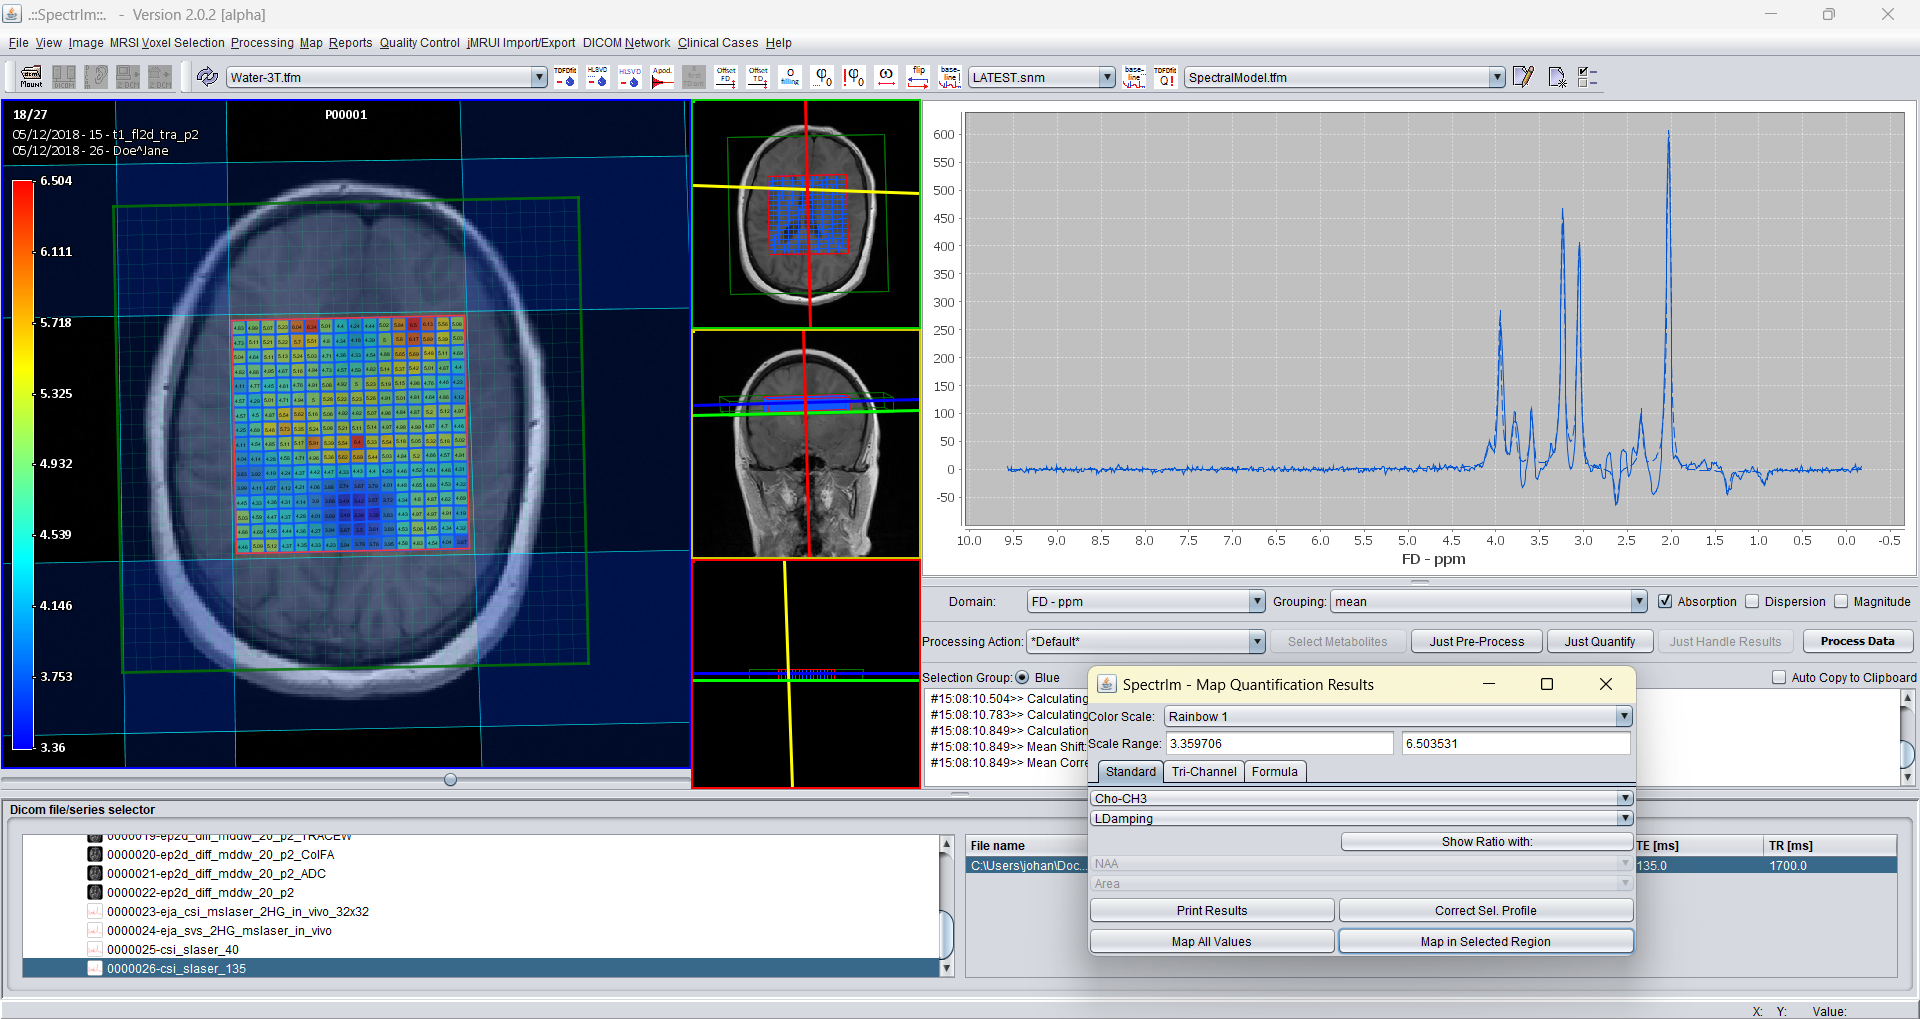
And as final example the Lorentzian difference map for all voxels:
And the zero order phase map: