MRSI voxel selection menu
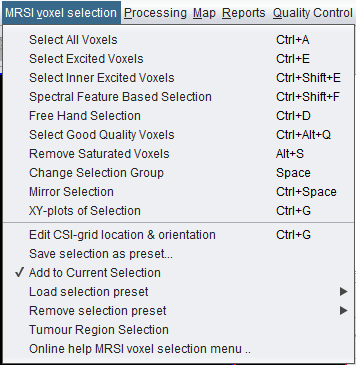
Version 3.0.1 Alpha MRSI voxel selection menu screenshot.
 spectrIm-QMRS
Version 3.0.3 Alpha International
spectrIm-QMRS
Version 3.0.3 Alpha International
Current release: 3.0.3 alpha international for Windows and Linux. This guide retains earlier screenshots and version-specific descriptions. Their original version labels are preserved; appearance and window placement may differ in 3.0.3. See the release notes.
Clinical Viewer GUI
The MRSI voxel selection menu provides commands for selecting, refining, grouping, storing, and visualizing voxels in a spectroscopic imaging grid. These selections define which spectra are displayed, processed, fitted, compared, mapped, exported, or used for reporting.
In spectrIm-QMRS, every MRSI grid position can be selected or unselected. A non-selected grid point is shown with a green border, while selected voxels are assigned to a selection group such as the blue or red group. The selected spectra can be displayed in the spectrum viewer and used as input for processing, fitting, map statistics, export, or comparison workflows.
The menu contains fast whole-grid selections, geometry-based selections, quality- and feature-based tools, freehand selection, selection mirroring, selection presets, and tools for creating XY-plot grids or manually defining tissue regions.
Version 3.0.1 Alpha MRSI voxel selection menu screenshot.
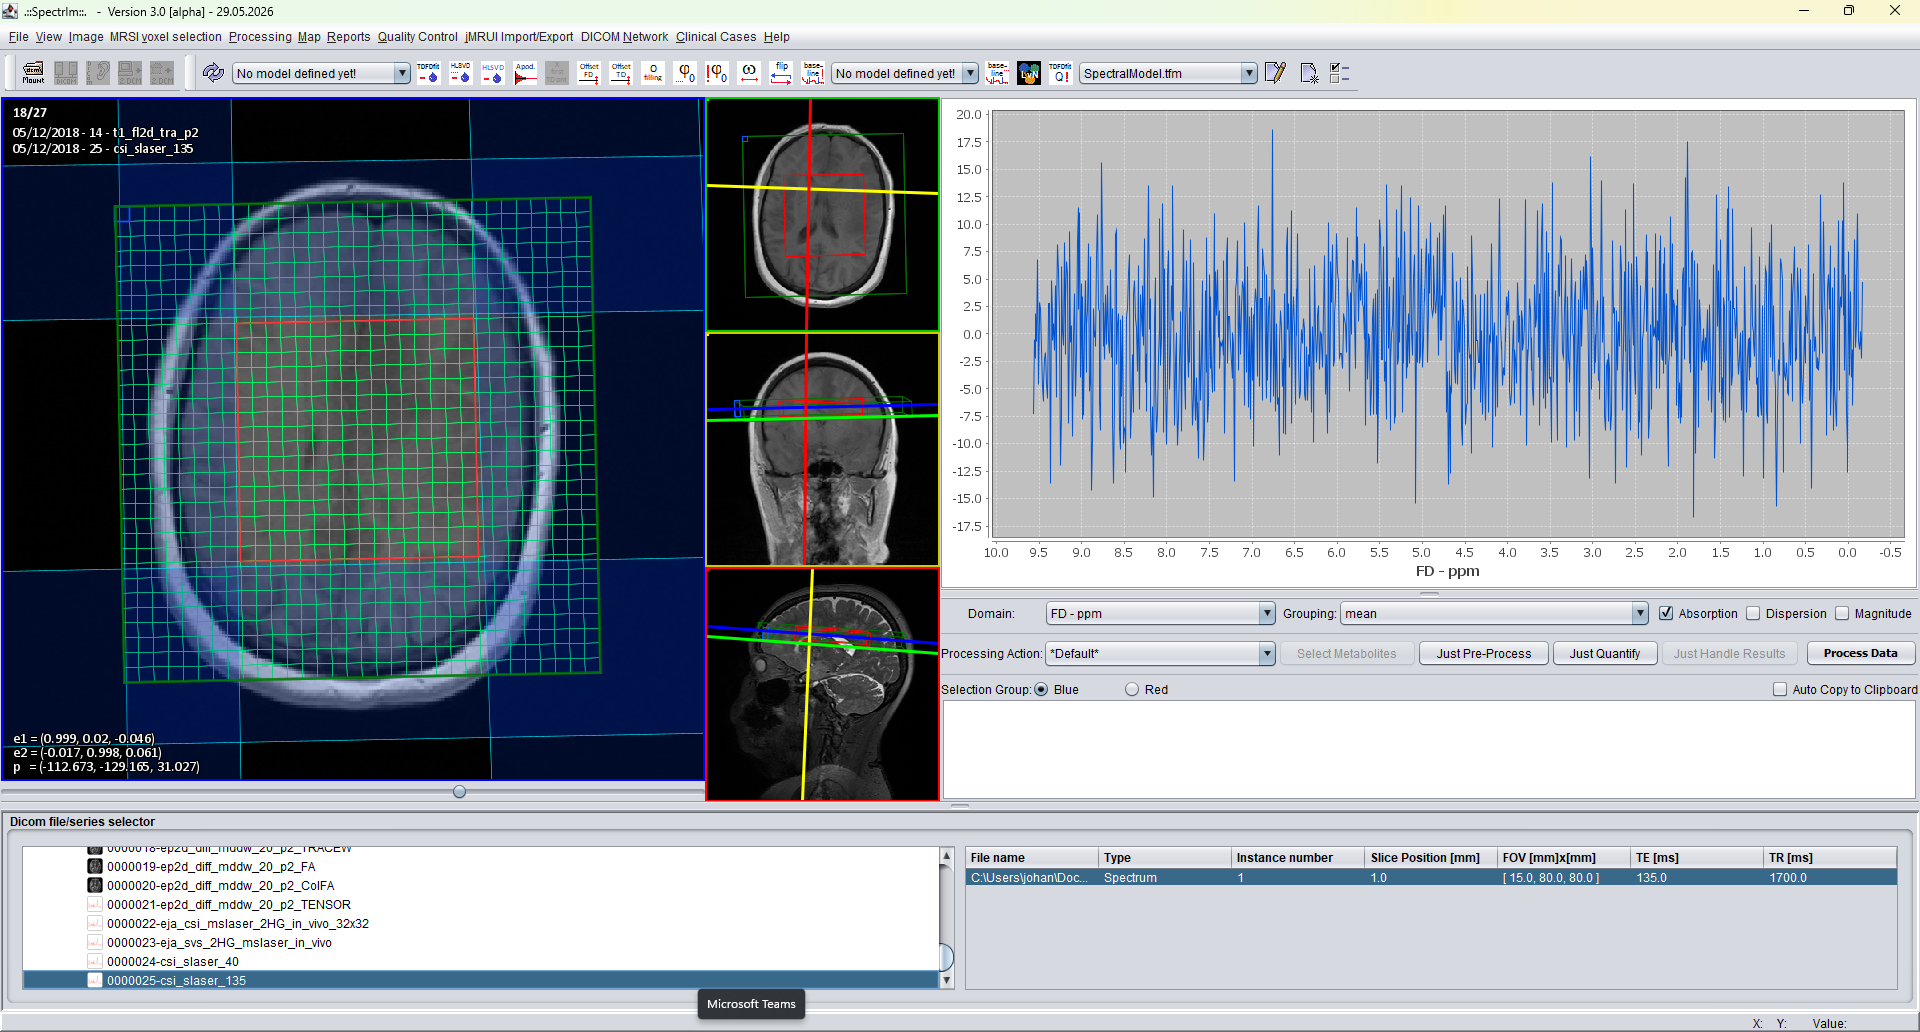
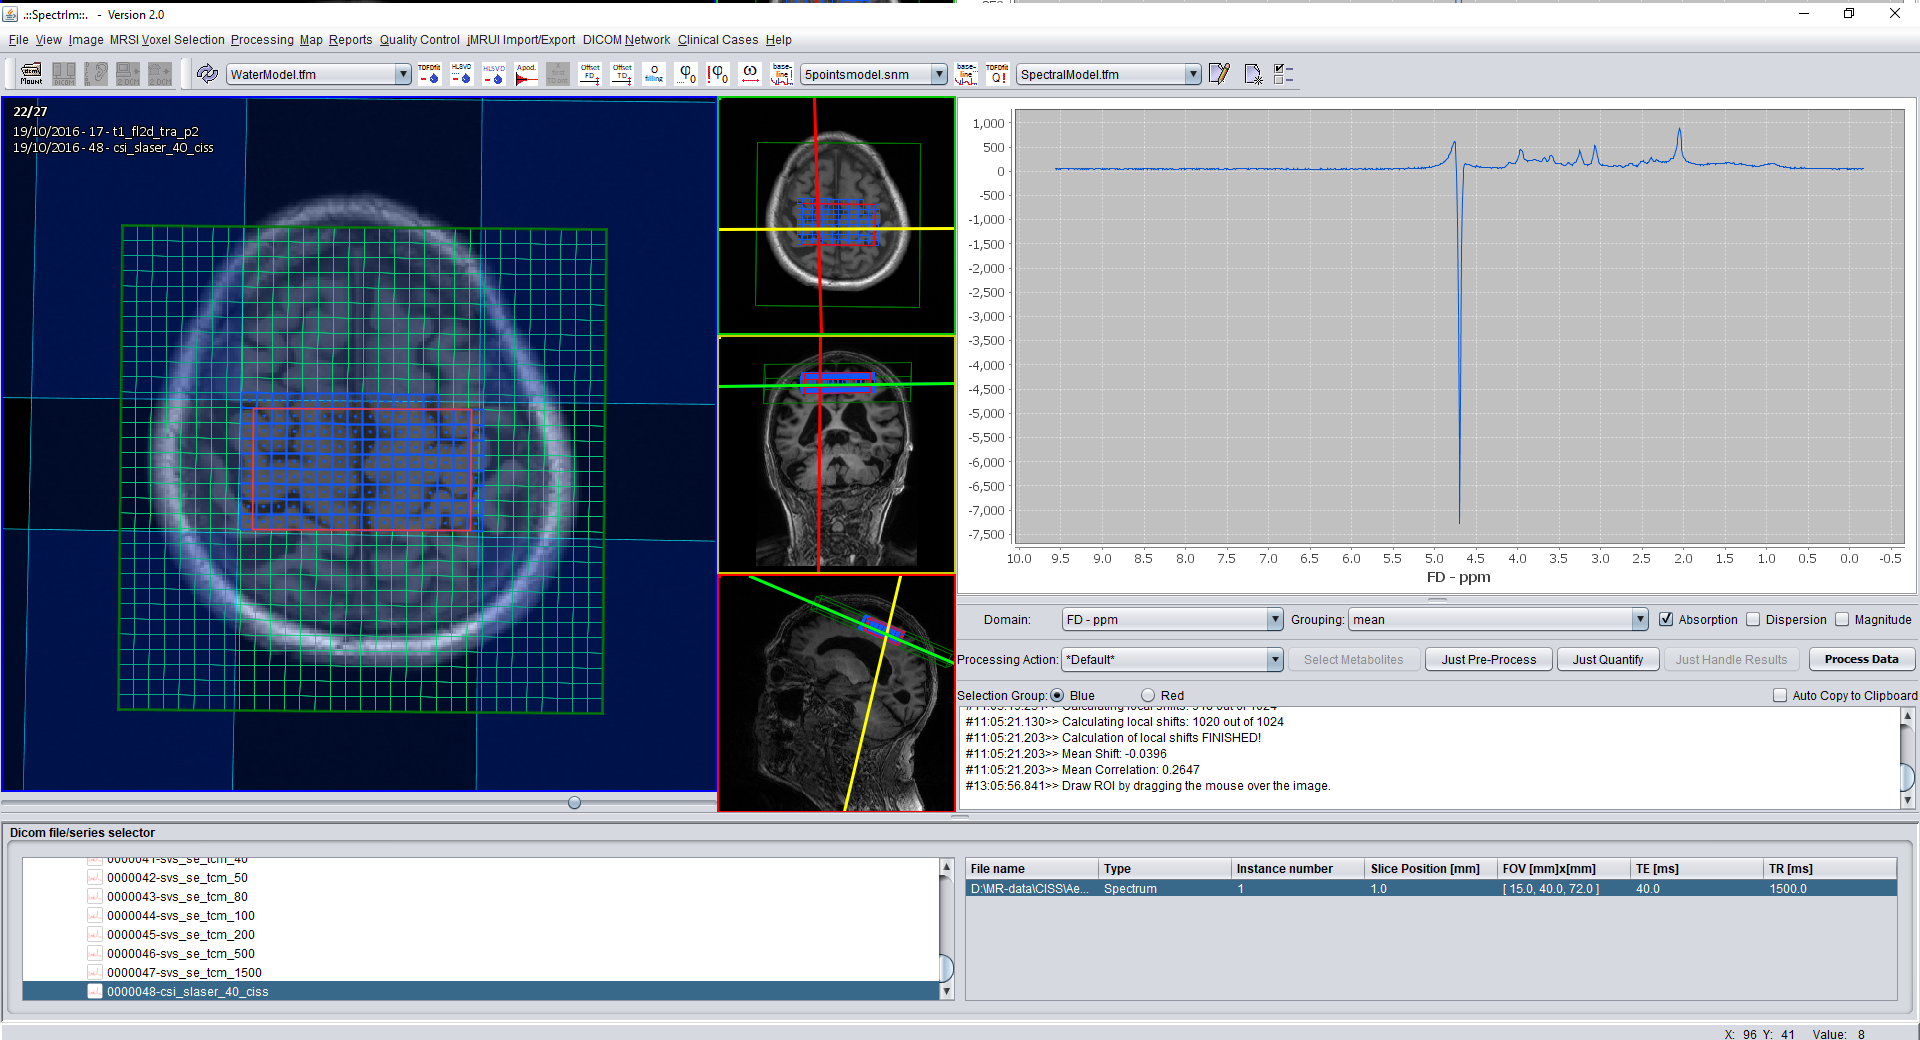
After loading an MRSI dataset, the anatomical image, CSI grid, orthogonal slice views, spectrum display, and DICOM file/series selector are visible. By default, the top-left voxel of the spectroscopy grid is selected after loading. At this stage the grid can be inspected before selecting the voxels that should be processed or quantified.
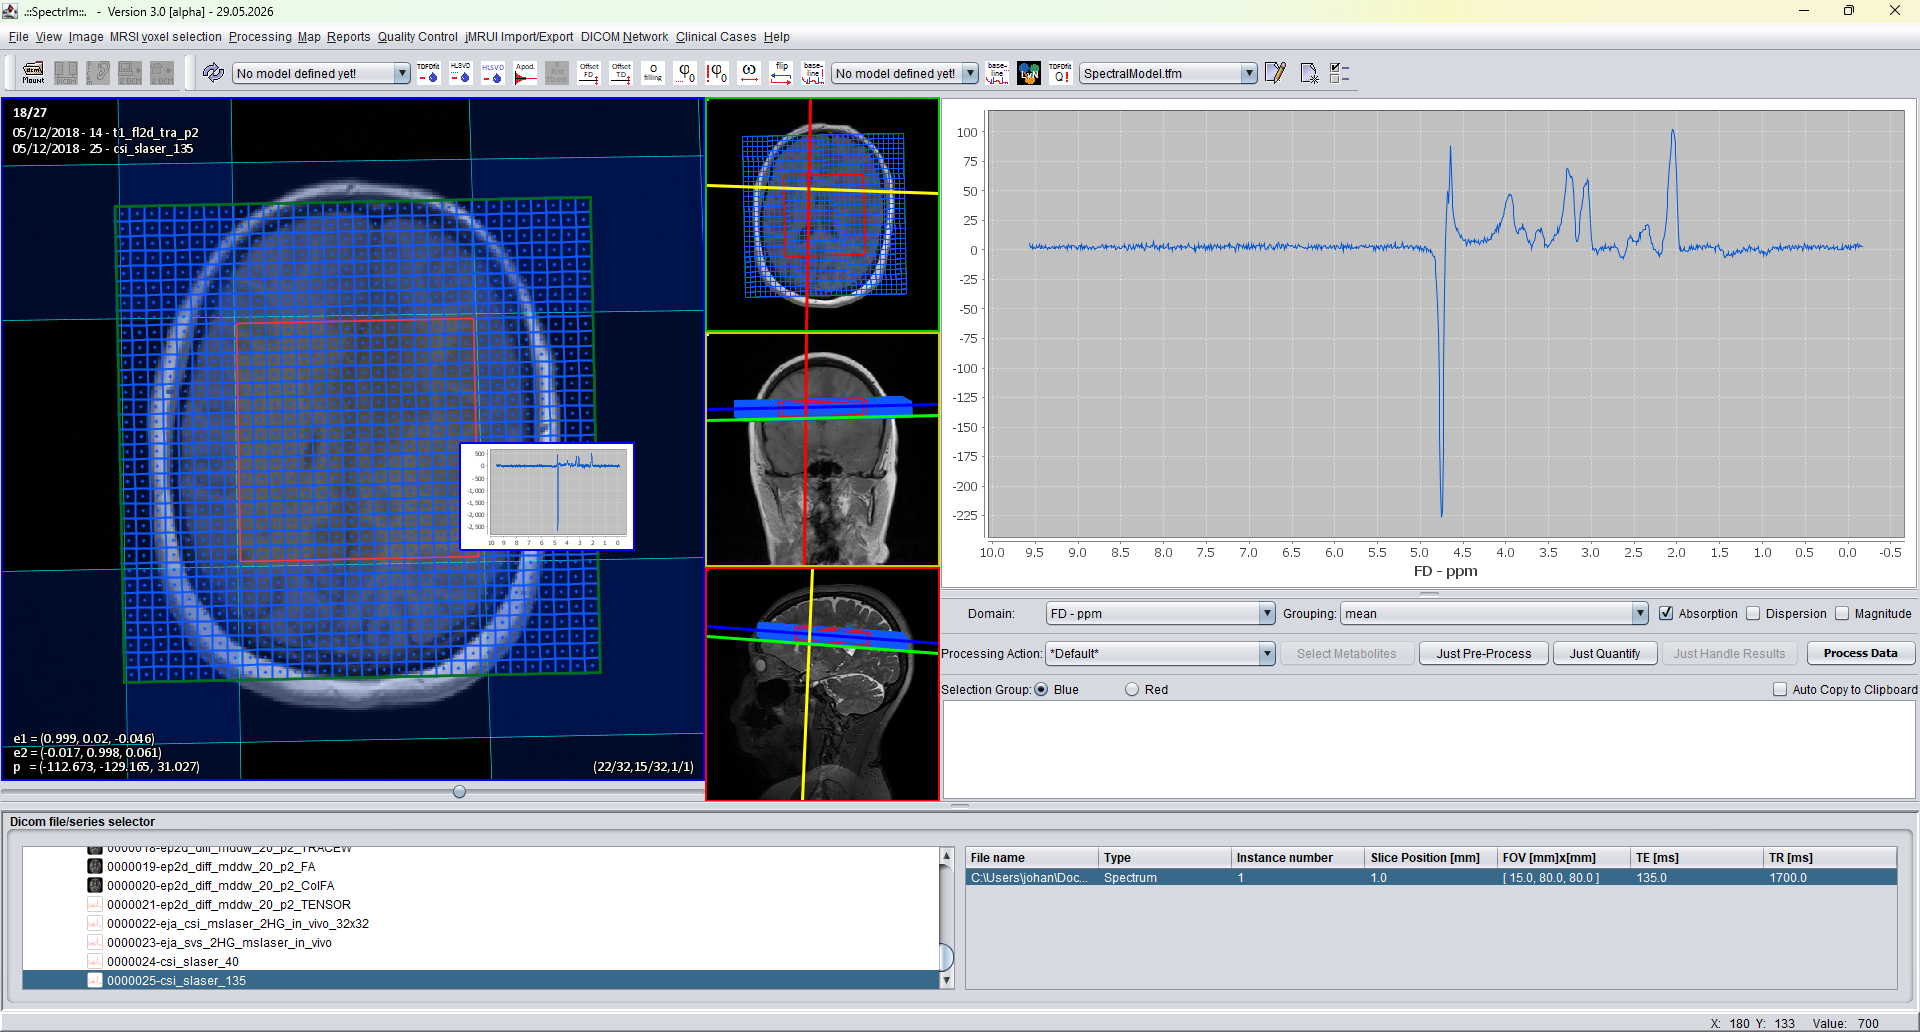
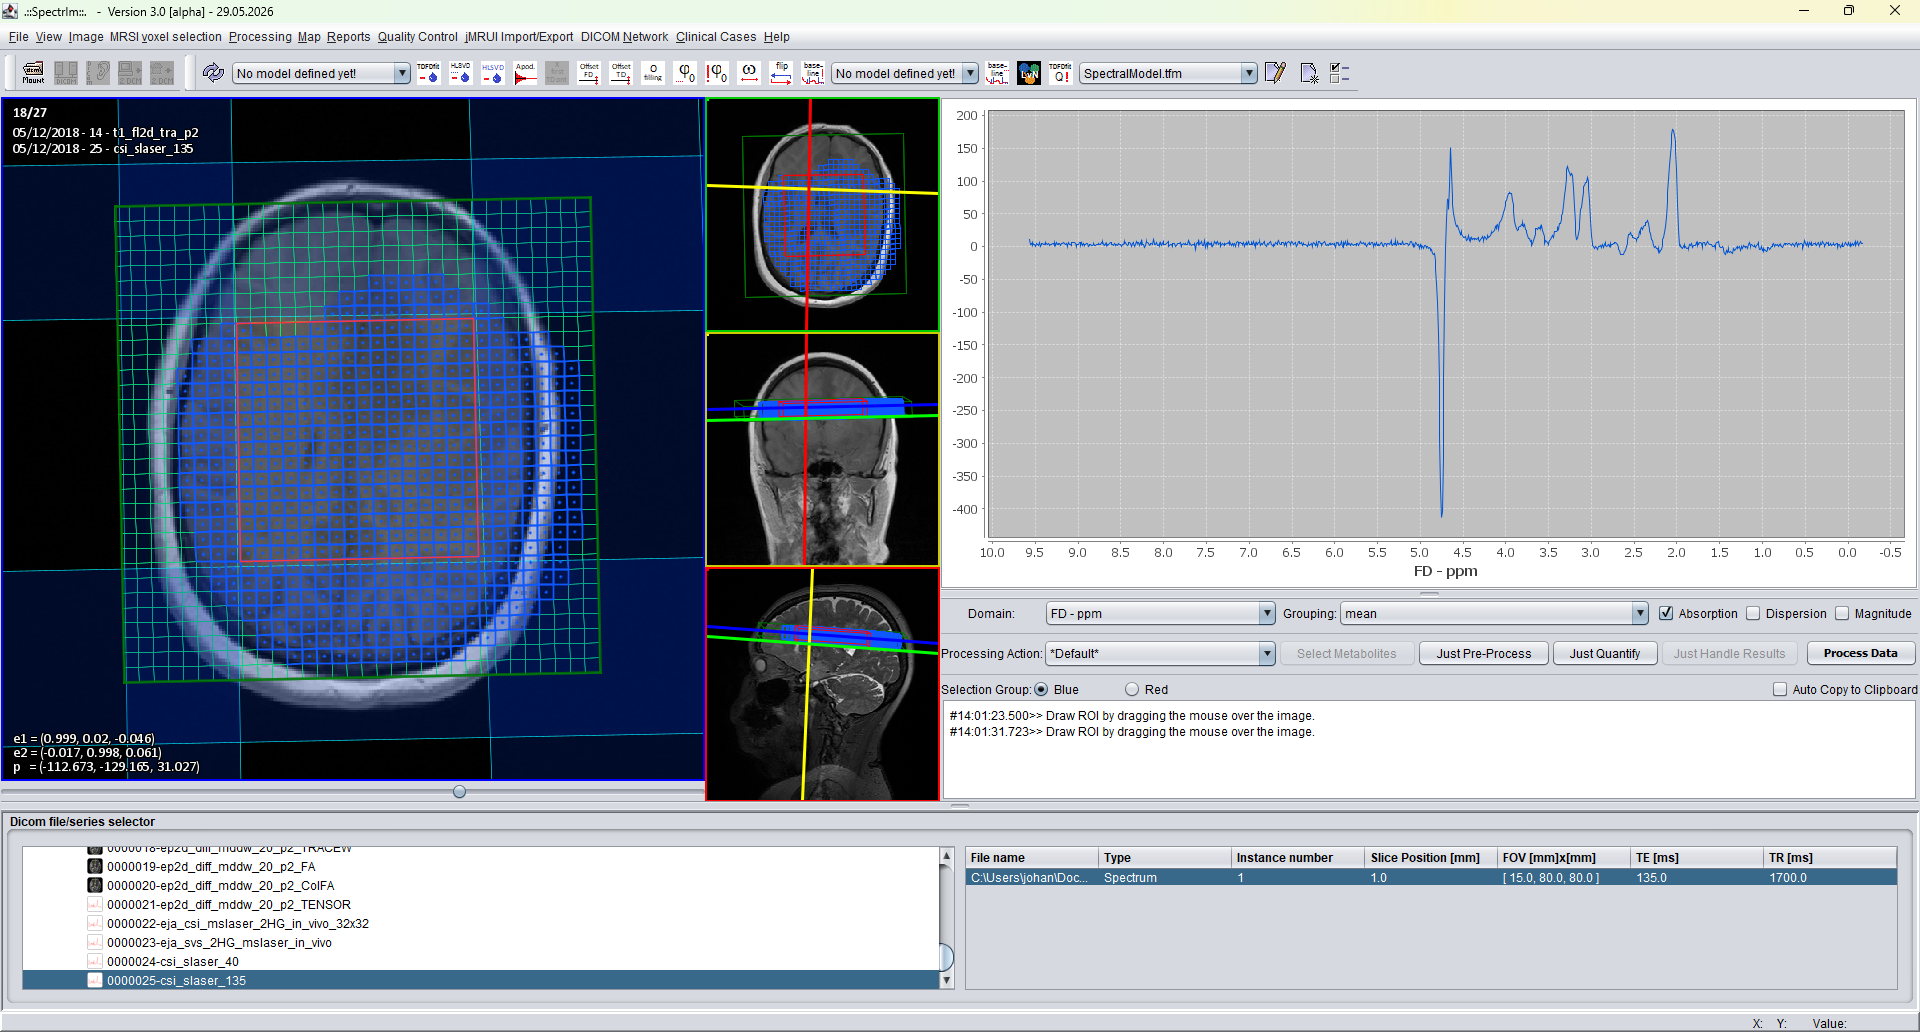
Selects all voxels in the displayed MRSI grid (Ctrl+A). This command is useful when a processing, export, plotting, or fitting action should be applied to the complete spectroscopic dataset, including grid positions outside the excited region.
Selects voxels that belong to the excited spectroscopy region (Ctrl+E). This avoids including grid positions outside the measured or meaningful spectroscopic volume.
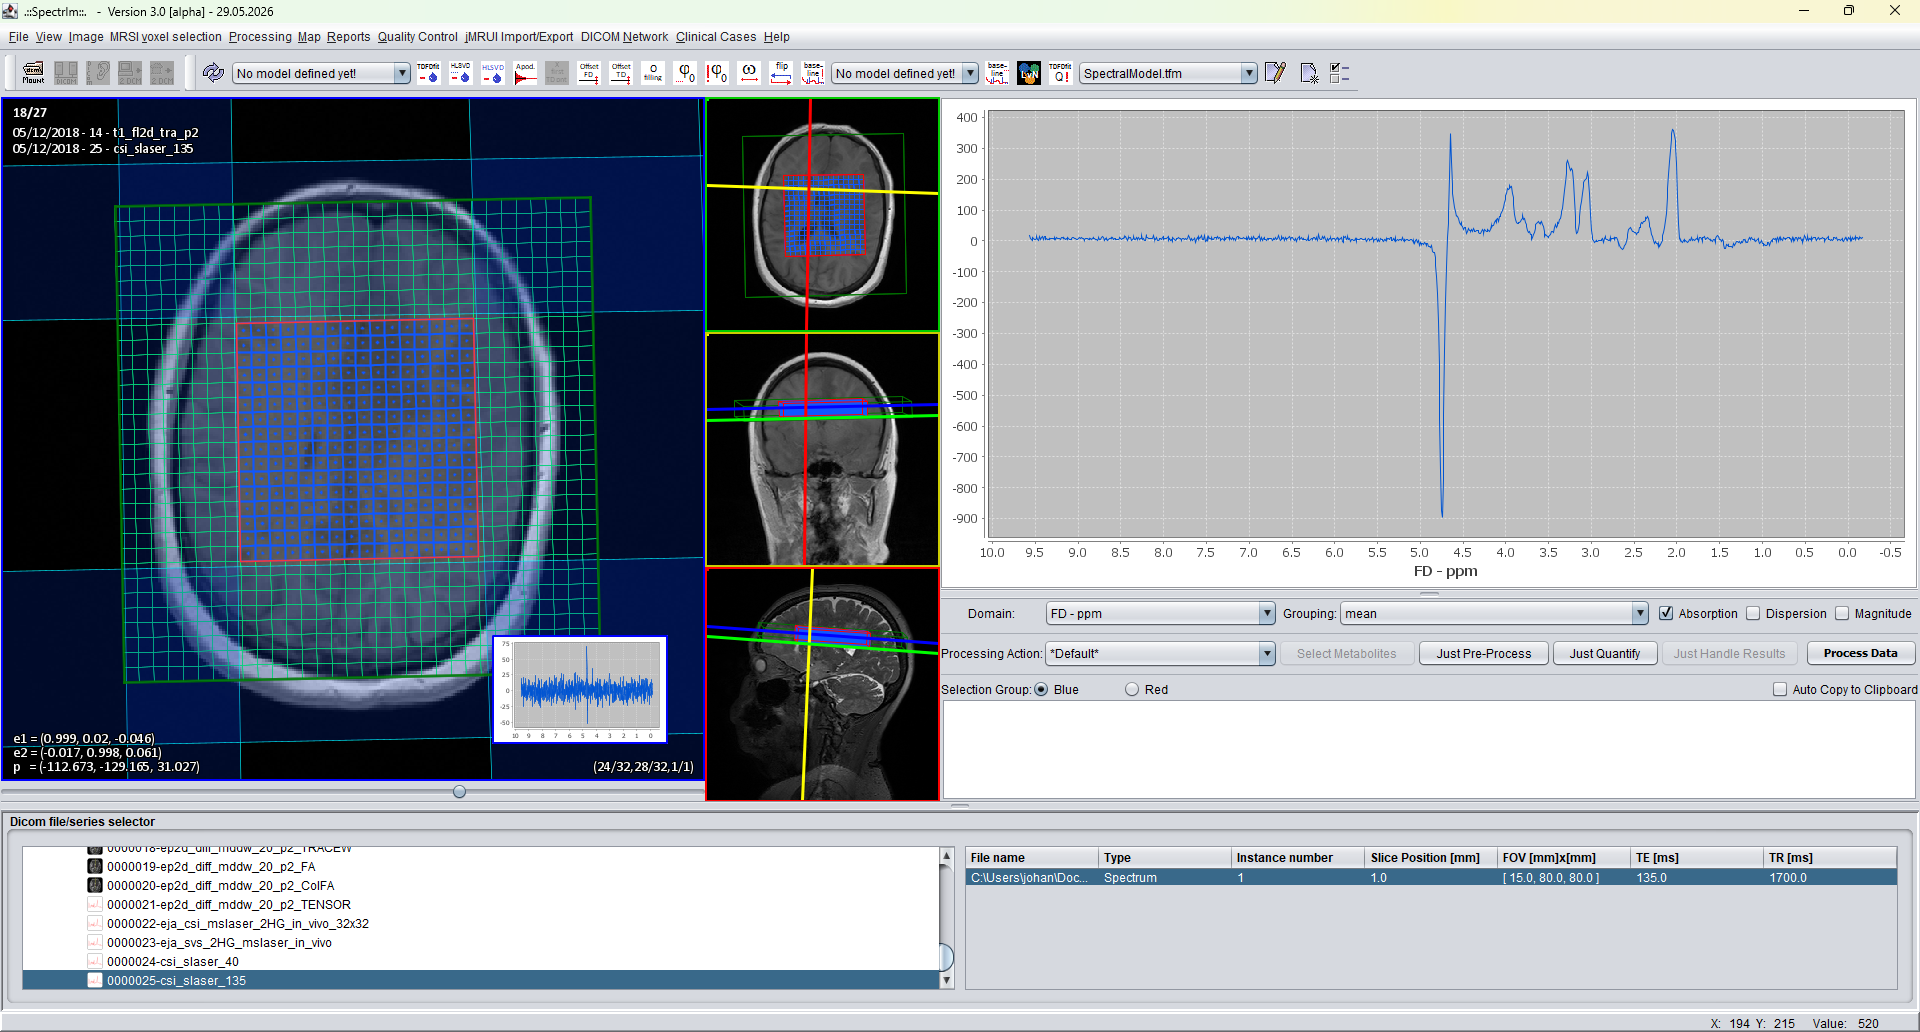
Selects only the inner part of the excited MRSI region (Ctrl+Shift+E). Boundary voxels are omitted, which can be useful when edge voxels are more likely to be affected by partial-volume effects, localization imperfections, or lower signal quality.
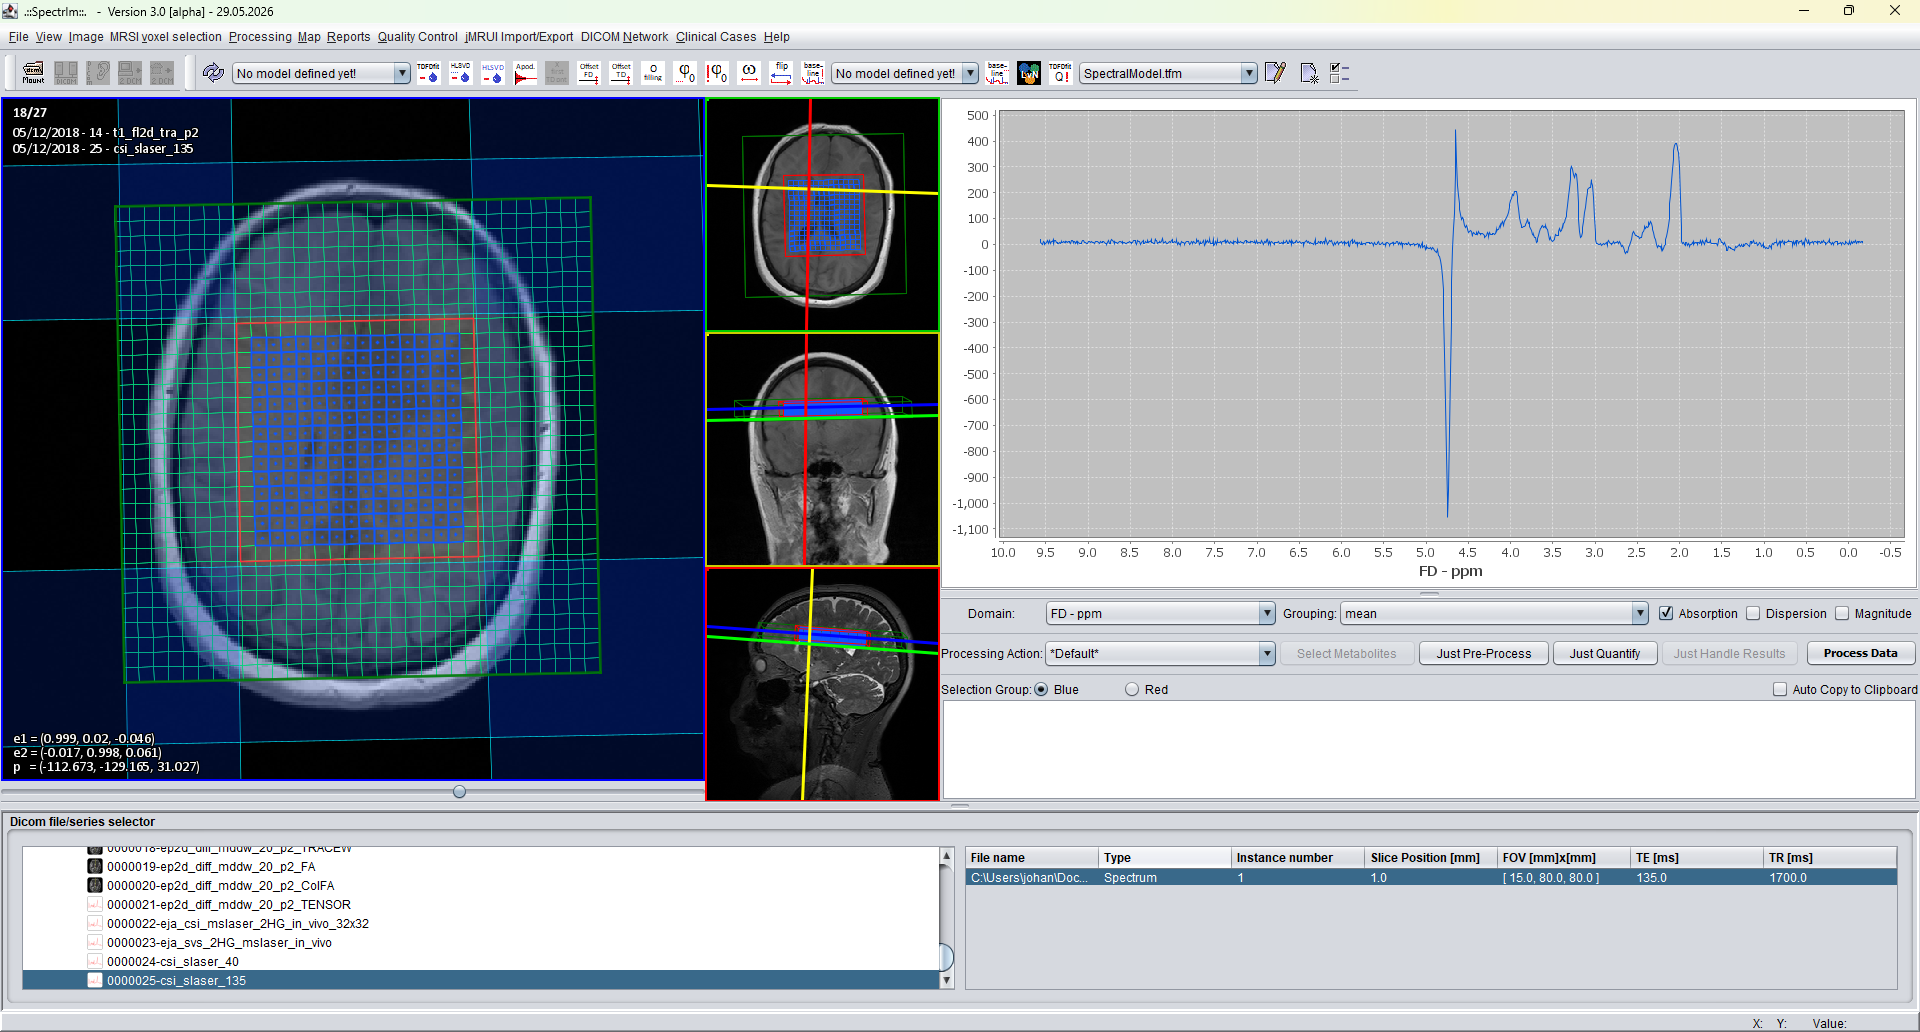
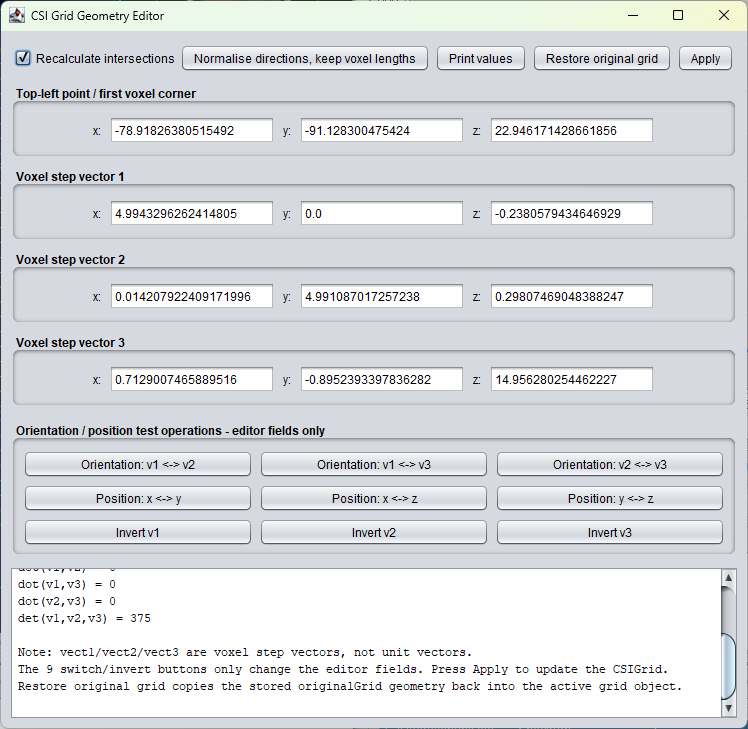
Opens the CSI Grid Geometry Editor. This dialog allows the top-left grid position and the voxel step vectors defining the CSI grid geometry and orientation to be inspected or manually changed.
In normal use this editor should not be needed. The grid geometry and orientation are determined automatically from the loaded data. It remains part of the released version as a diagnostic or recovery tool for exceptional cases. A known XA60 issue for 3D data geometry has been fixed for version 3.1, so this dialog is expected to become increasingly unnecessary.
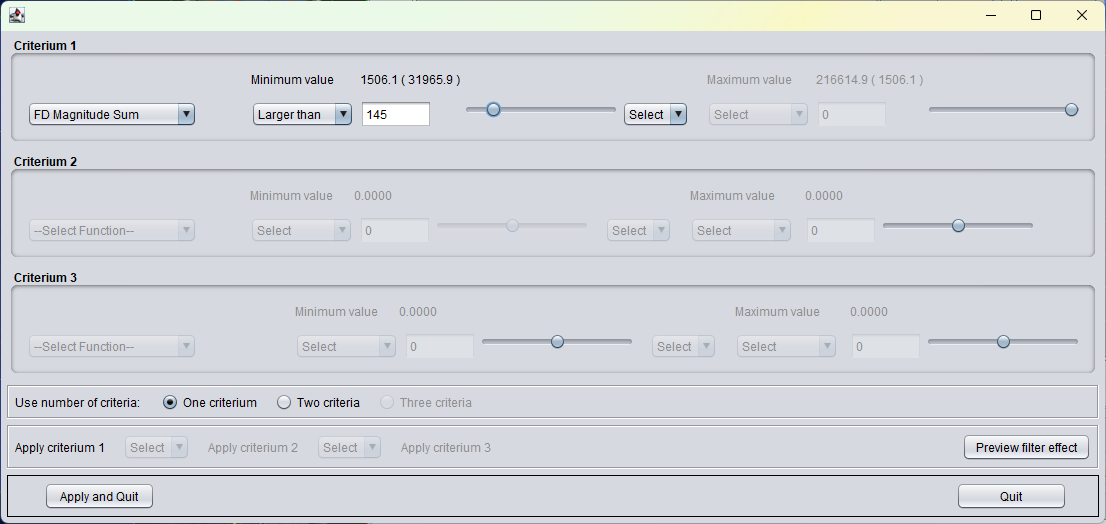
Loads all spectroscopy voxels of the currently loaded MRSI dataset and opens the spectral-feature selection panel. The user can select one of the standard spectral feature maps implemented in spectrIm-QMRS and use it to select voxels by numerical feature range.
Up to three criteria can be defined. Each criterion selects a feature map, a lower or upper comparison such as larger than or smaller than, and a threshold value. Criteria can then be combined logically, making it possible to select voxels inside or outside feature-amplitude ranges.
The current implementation exposes frequency-domain peak and integral features, time-domain and frequency-domain descriptive statistics, noise estimates, quality scores, temperature maps, and TDFDFit quality numbers when these values are available in the loaded dataset. These are spectrum-derived features and feature derivatives of the same general type used by Nuno Pedrosa de Barros in the automatic MRS(I) quality-filtering work: they summarize peak strength, noise, signal decay, distributional shape, and other global properties of each voxel spectrum.
In the thesis and the associated quality-control publications, spectral features were used so that a classifier could judge spectral quality from robust descriptors rather than from every individual spectral point. Important examples include maximum peak SNR in selected frequency ranges, mean SNR in frequency-domain and time-domain ranges, relative time-domain changes, and global TD/FD statistics such as maximum, mean, standard deviation, skewness, and kurtosis. The interactive menu shown here can therefore be understood as a manual, transparent way to explore and filter voxels using related feature maps.
For quality filtering, see Nuno Pedrosa de Barros' thesis sections on automatic quality control and the related paper Automatic quality control in clinical 1H MRSI of brain cancer. The labeling-efficiency and human-versus-machine quality assessment papers listed on the Citing spectrIm-QMRS page provide further context for how such spectral features can support MRS(I) quality-control workflows.
To be checked manually: the feature list above follows the current Java implementation in version 3.0.1 Alpha. Exact available maps depend on the loaded data and on whether quality scores, temperature values, or TDFDFit results have already been computed.
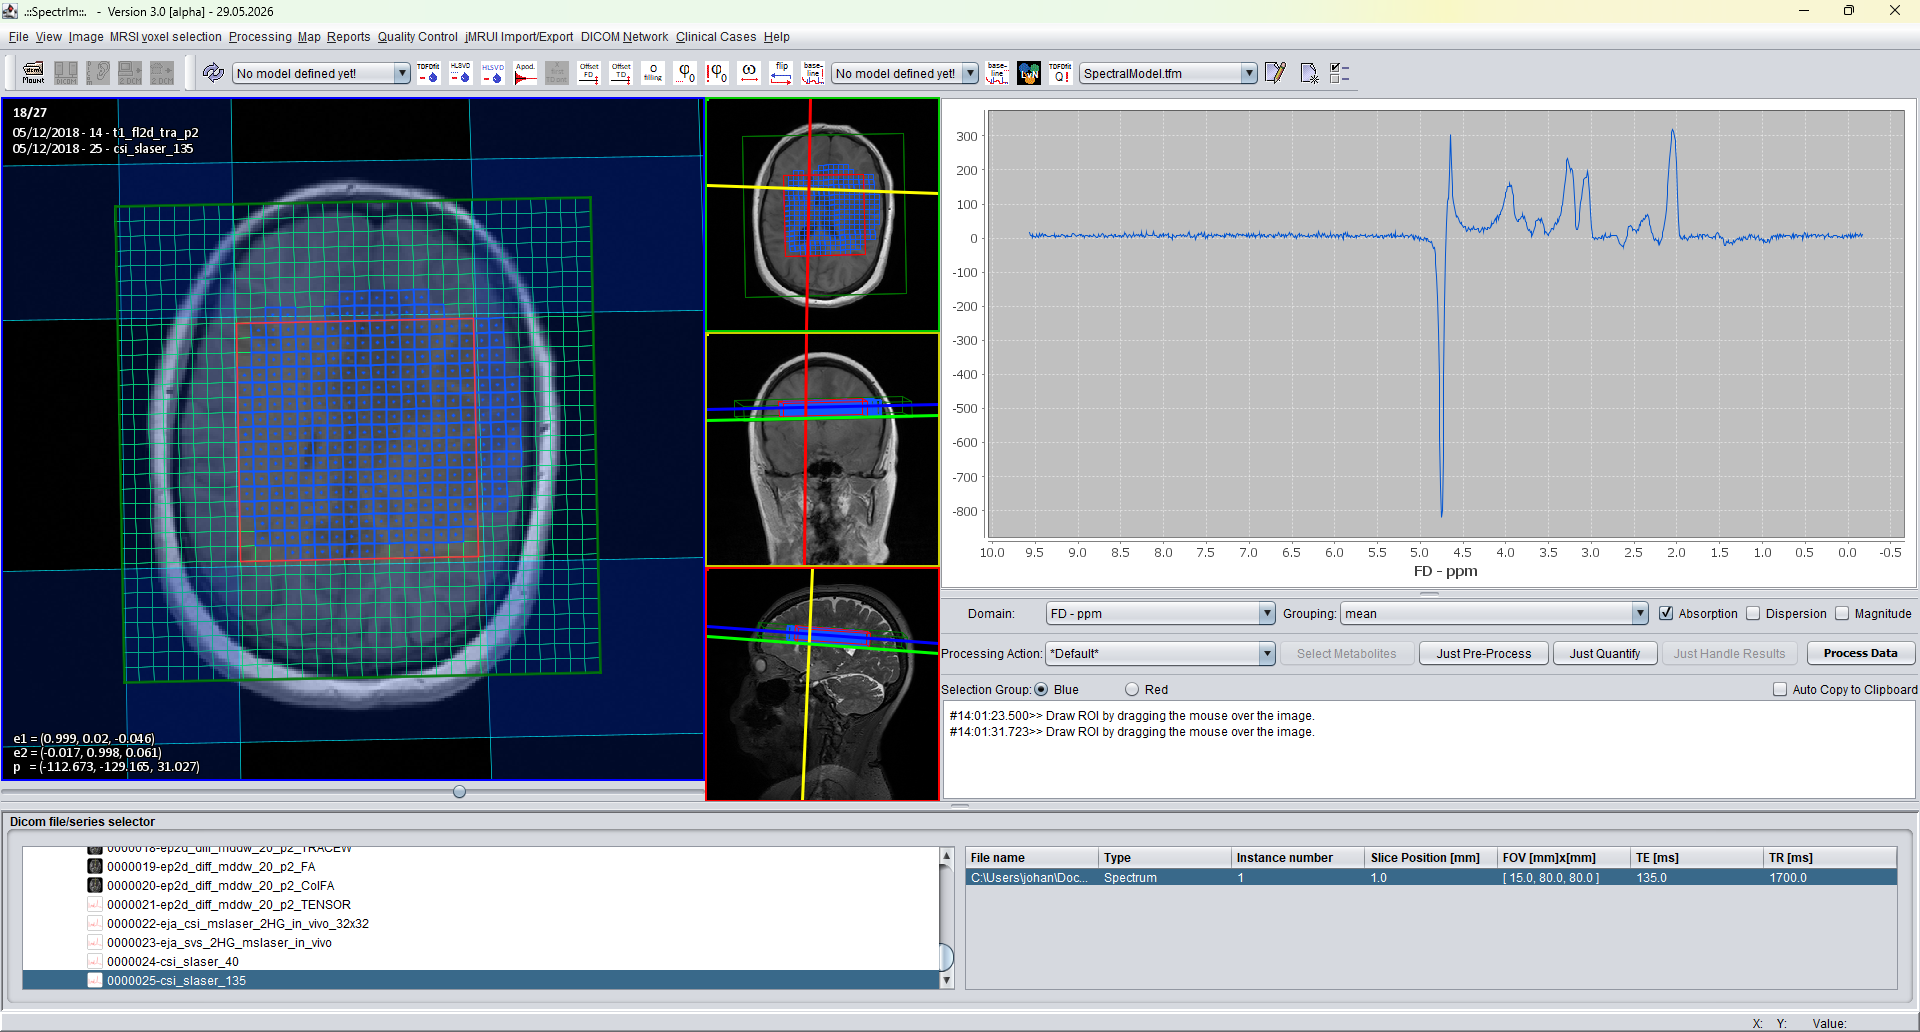
Enables manual voxel selection by drawing a closed contour around the desired region (Ctrl+D). The drawn contour is automatically closed by the selection algorithm, so the user can sketch the region of interest directly on the anatomical image.
After the contour has been drawn, spectrIm-QMRS determines the internal voxels and assigns them to the current selection group. This is useful when the region follows anatomy, lesion boundaries, or another visual pattern that is easier to define graphically than with a rectangular selection.
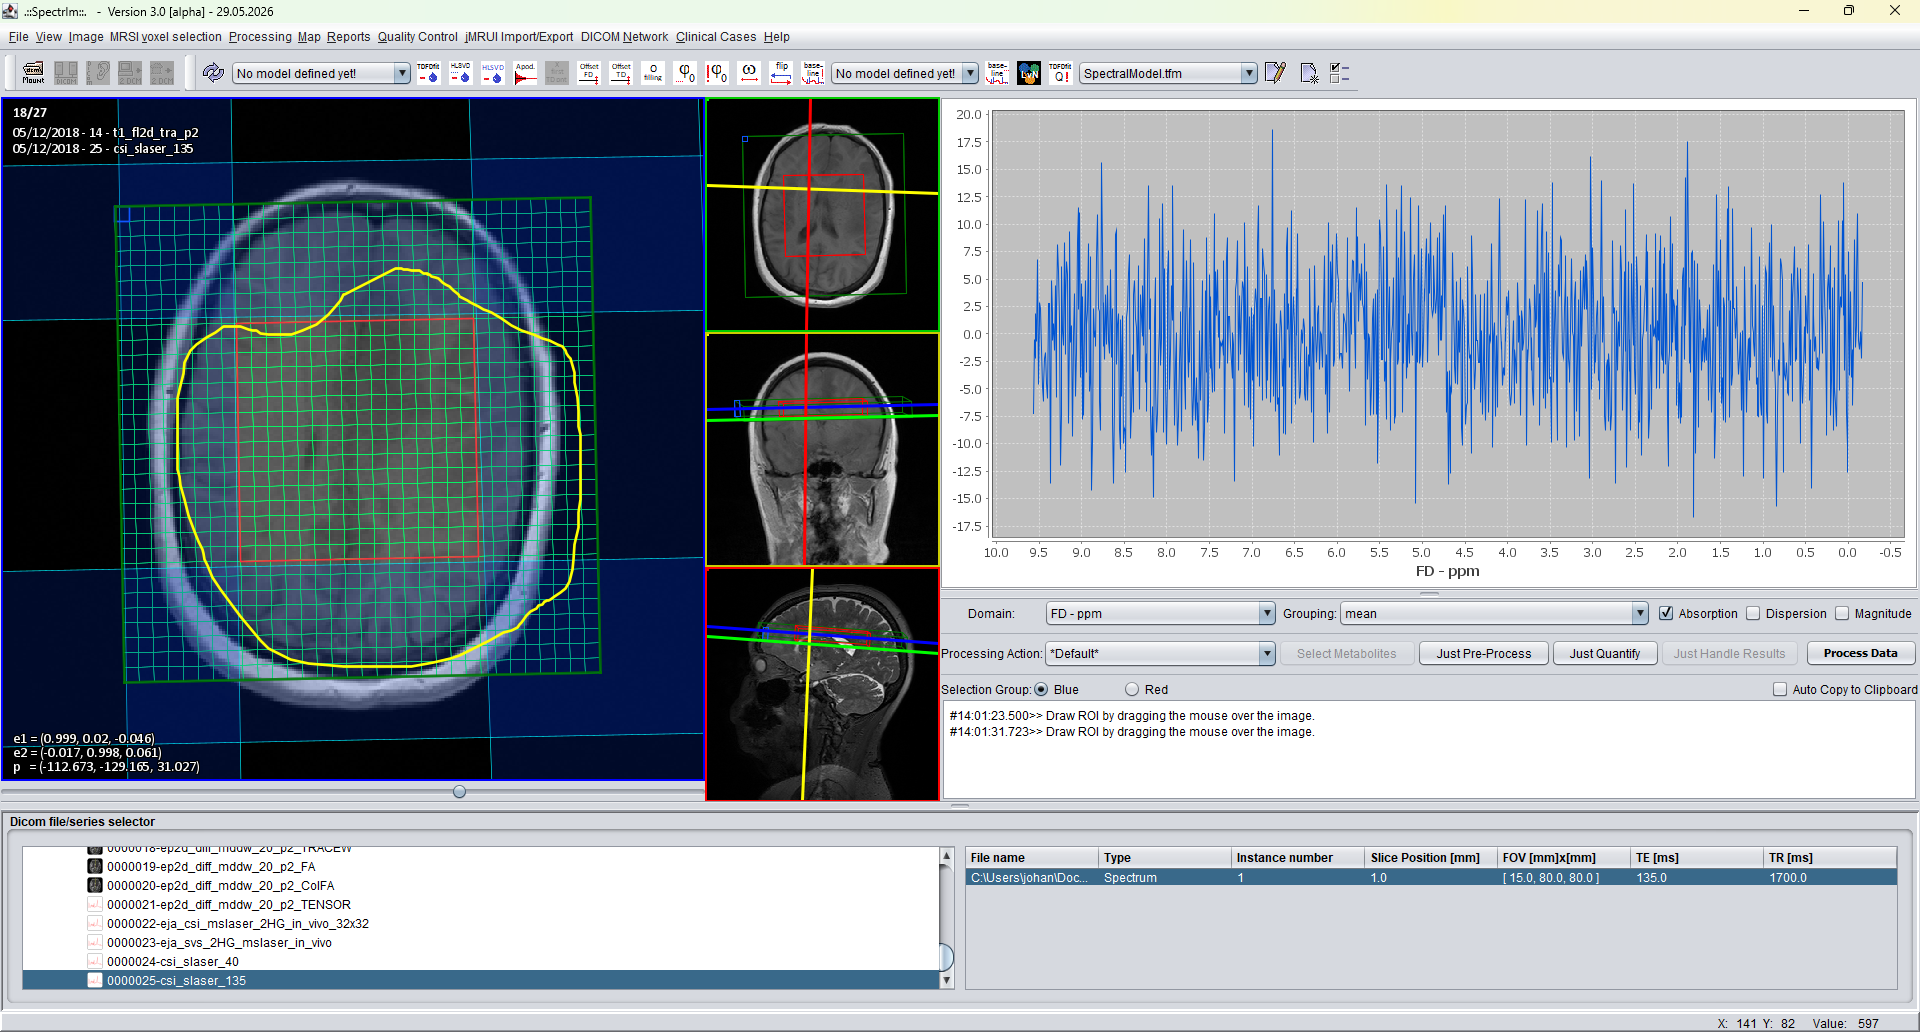
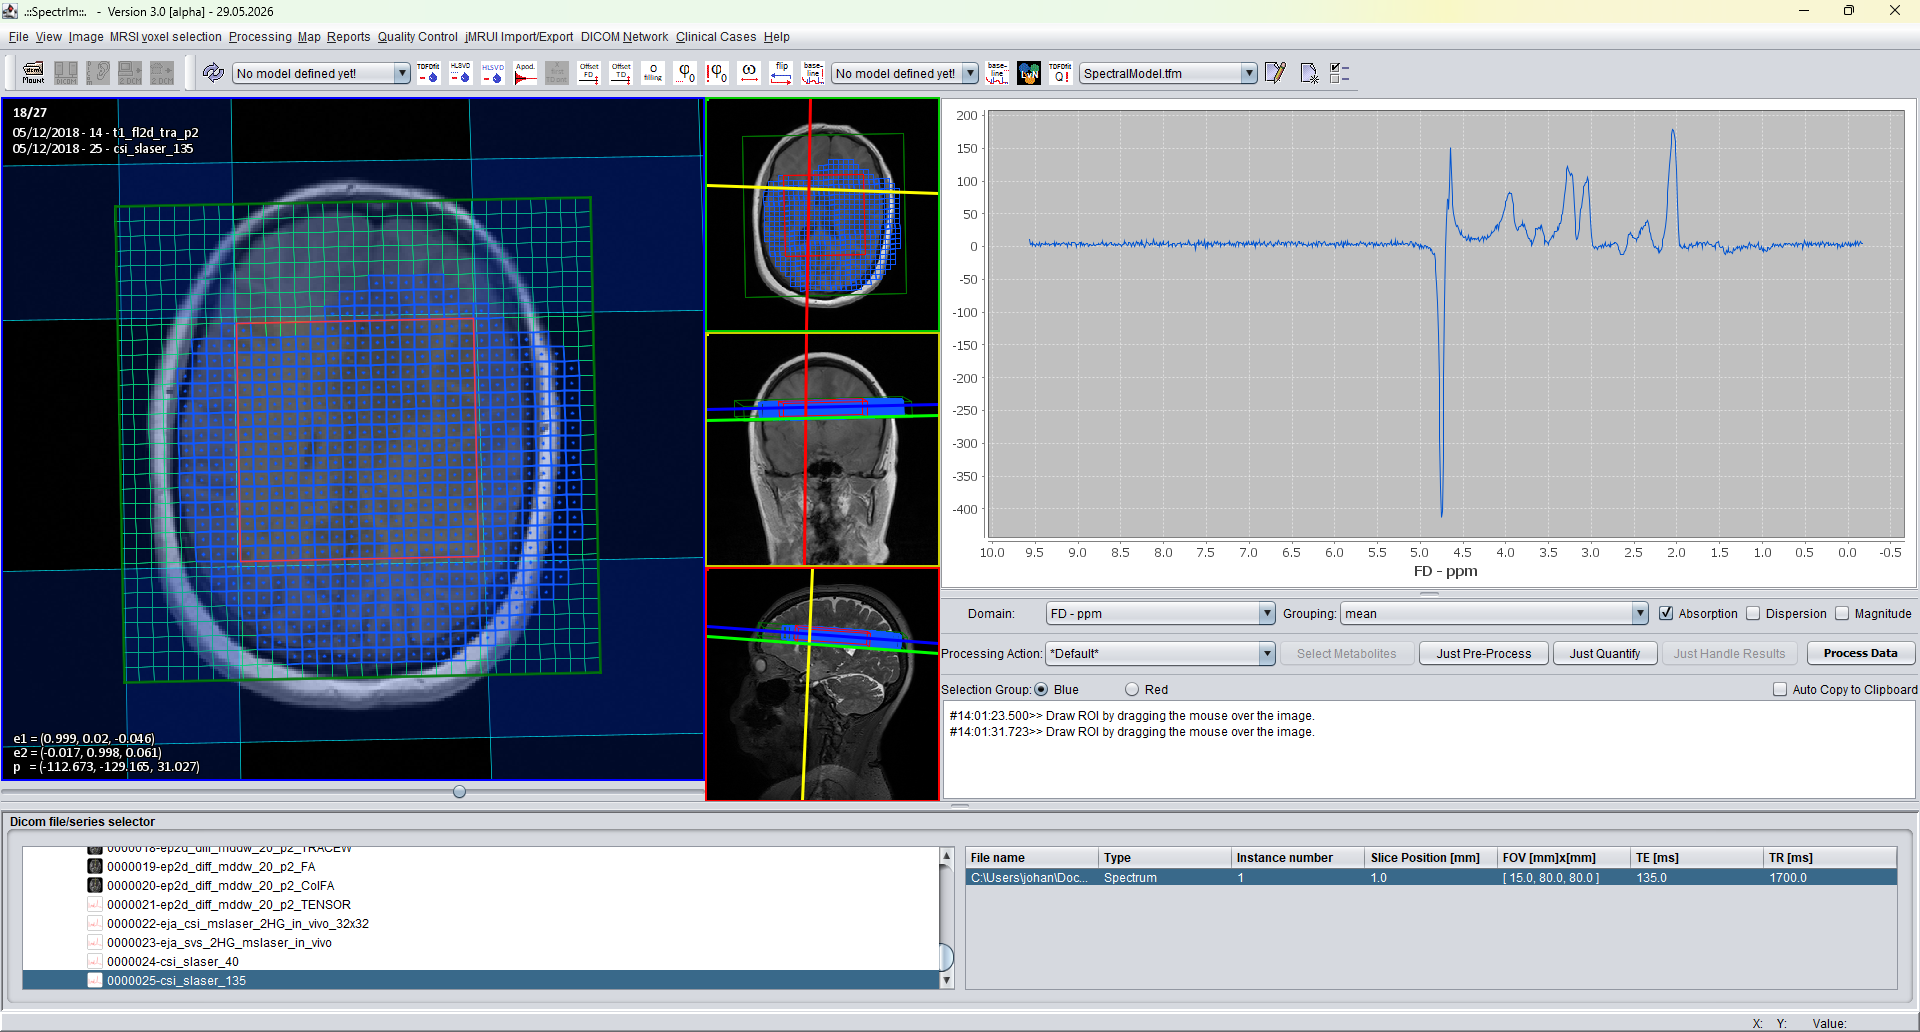
Selects voxels that pass spectral quality criteria (Ctrl+Alt+Q). This command can only be used when a valid random-forest classifier is available for the current data and quality-control workflow.
The classifier estimates a quality score for each spectrum from spectrum-derived features and feature derivatives of the type described in Nuno Pedrosa de Barros' thesis. The score is interpreted as the estimated probability that a rater would accept the spectrum. Voxels whose scores pass the configured quality criterion can then be selected automatically for further processing, fitting, mapping, or review.
See the Quality Control menu page for the classifier workflow, prerequisites, and the relationship between manual labels, spectral features, Random Forest classification, and quality maps.
Removes voxels that lie within pulse-sequence saturation bands from the current selection (Alt+S). The saturation bands are shown in the anatomical viewer as translucent stripes. Voxels intersecting these bands are removed so that spectra affected by intentional saturation are not included in later analysis.
In the current example, the result is equal to the Select Excited Voxels result, because the selected excited region does not leave additional saturated voxels to remove.
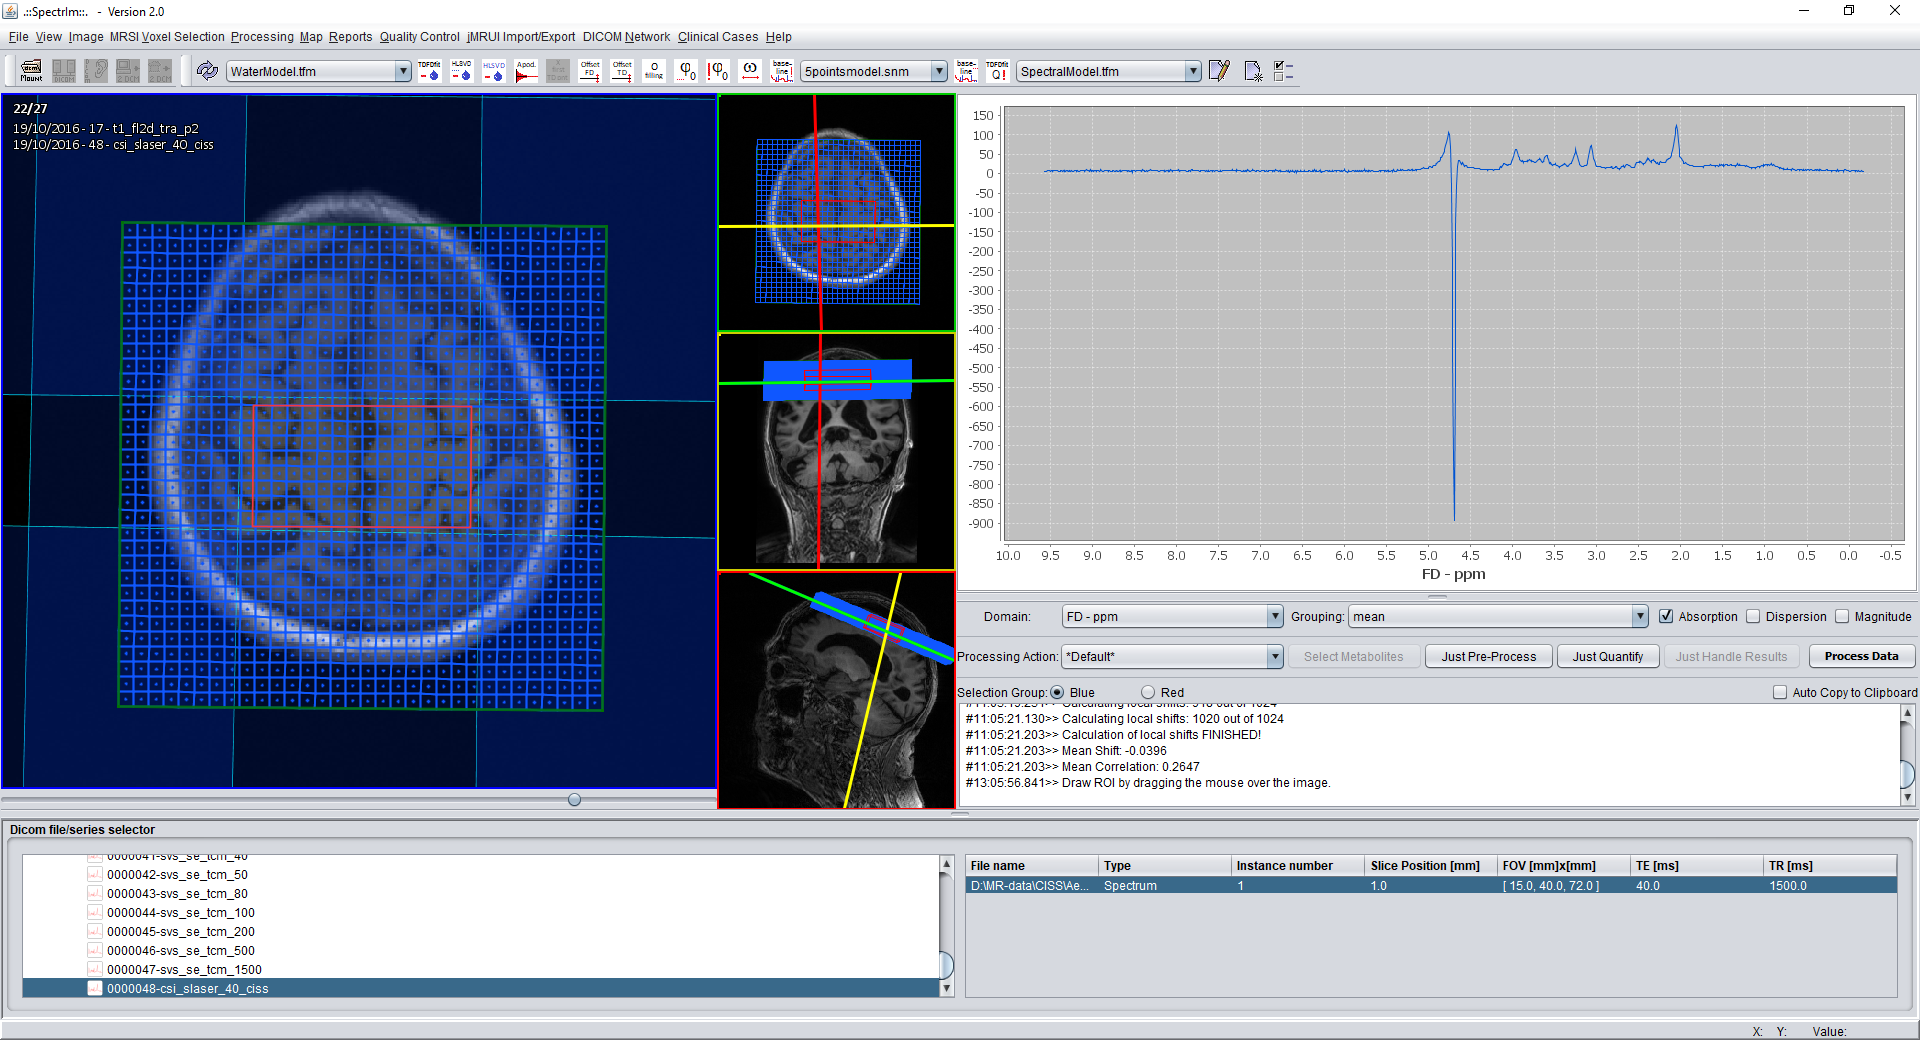
To be defined: confirm whether the v3 implementation is still vendor-specific or works generally across supported DICOM data.
Switches the active voxel selection group. spectrIm-QMRS allows the user to select one or more voxels in the blue group and one or more voxels in the red group. This makes it possible to keep two separate spectrum selections in the same dataset, for example lesion versus control tissue, tumor versus contralateral tissue, or any two regions that should be compared spectroscopically.
The menu item toggles which group receives new selections. The blue/red radio buttons on the right-hand side below the spectrum display panel provide the same function.
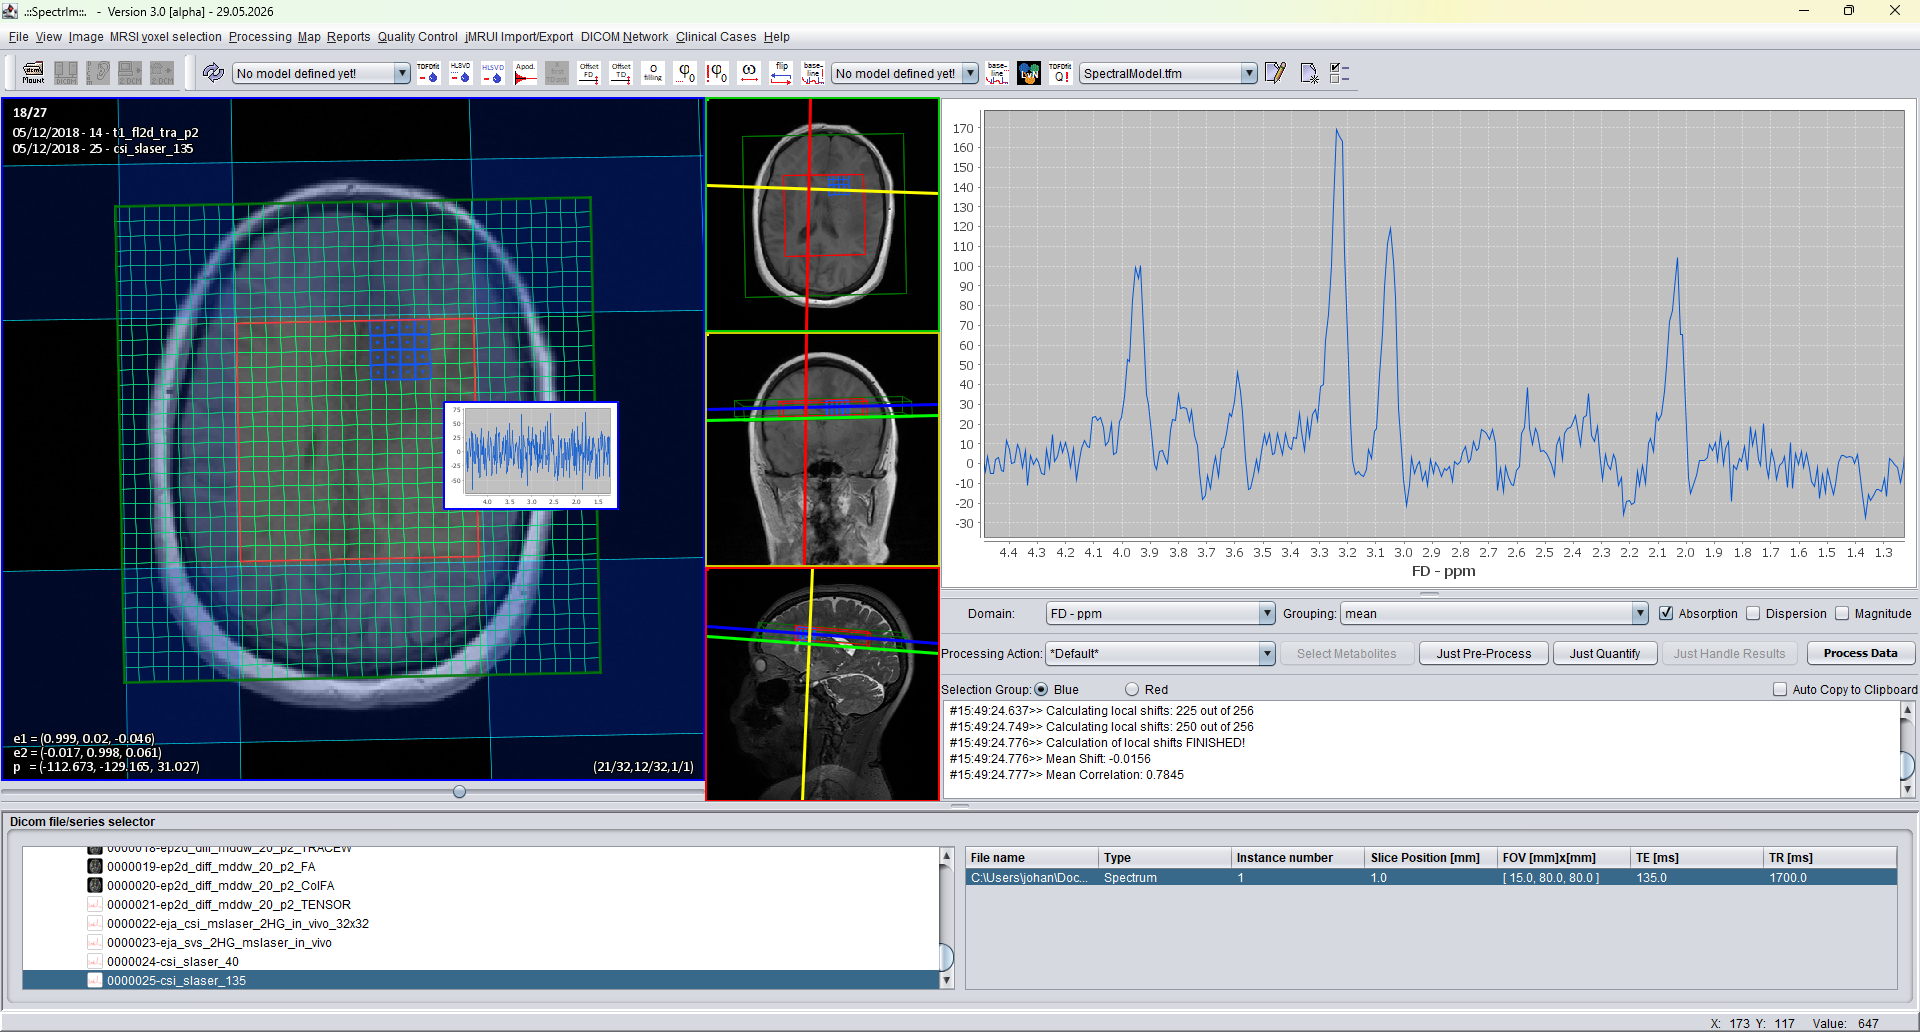
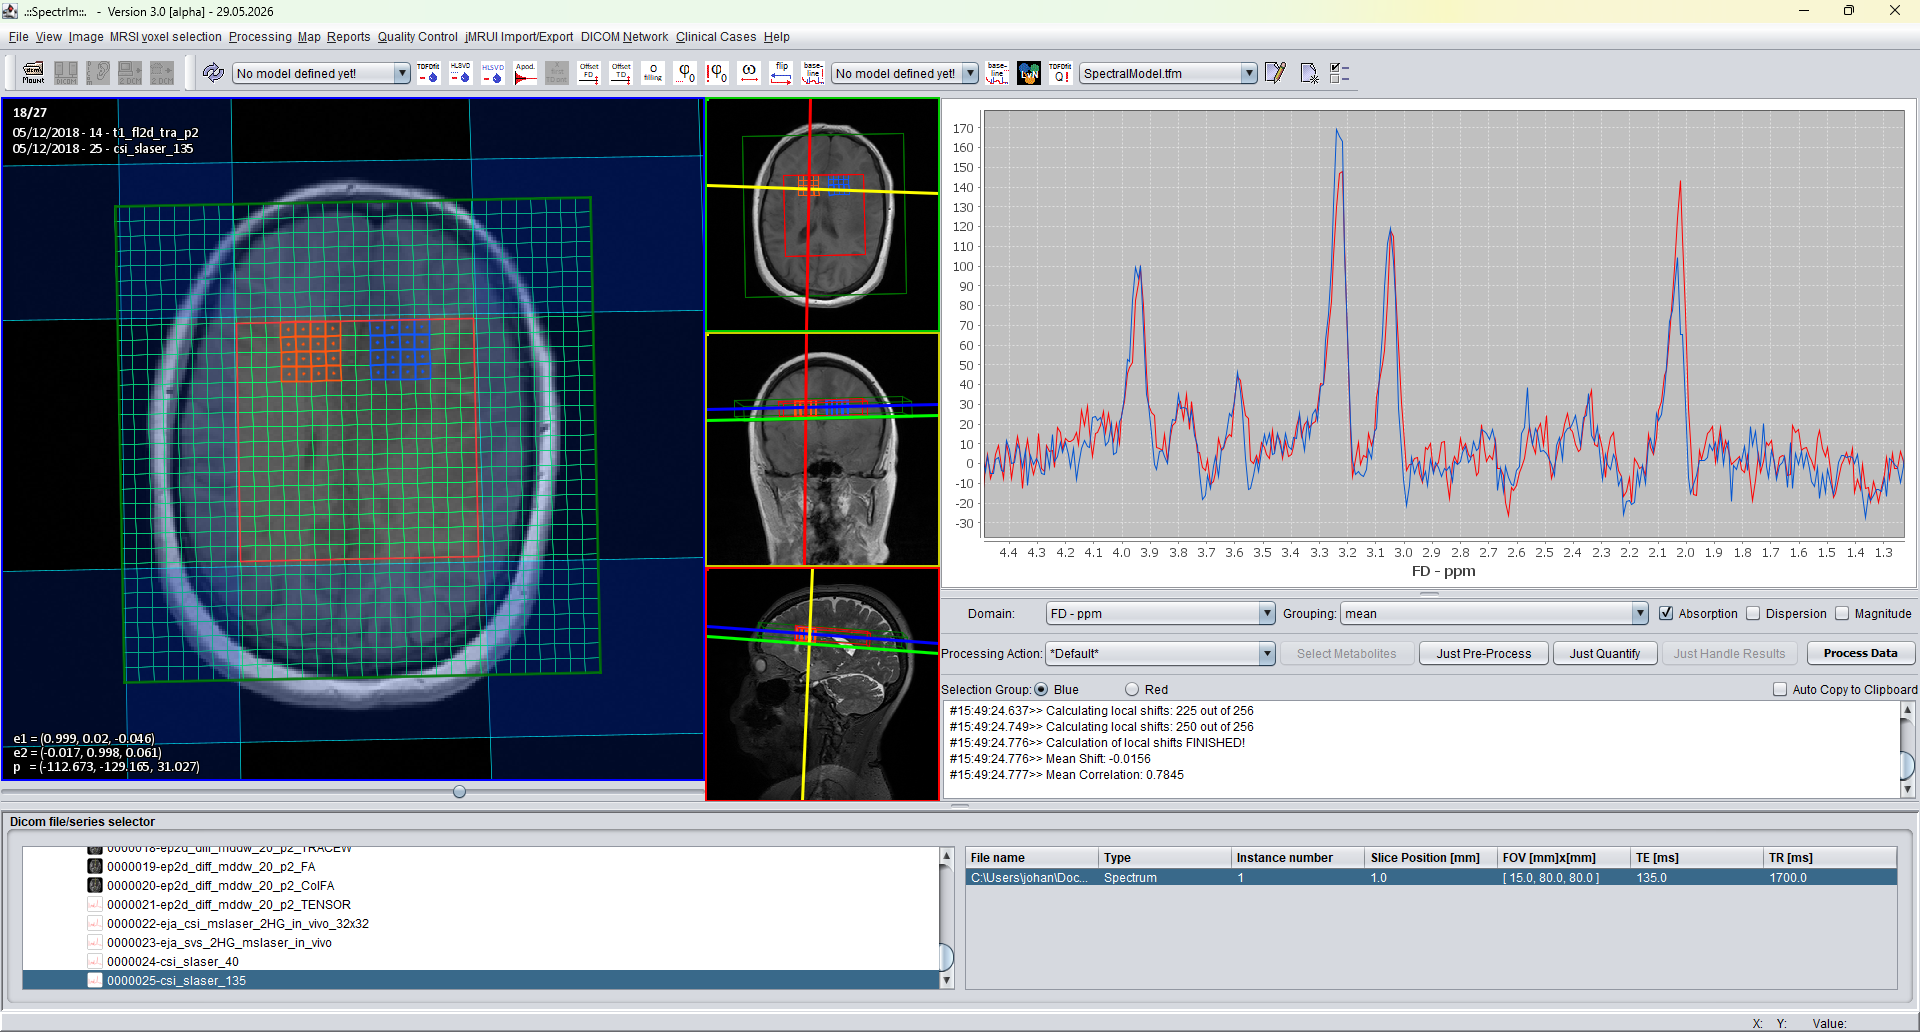
Mirrors the current voxel selection to the opposite side of the MRSI grid (Ctrl+Space). A typical use is to define a blue-group selection in one hemisphere and create the corresponding mirrored red-group selection for immediate left-right comparison.
The example shows a small blue selection before mirroring and the resulting red mirrored selection afterwards. Because both selections are kept as independent blue and red groups, their mean spectra can be overlaid directly in the spectrum display.
Toggles how loaded selection presets are applied. When this option is enabled, the loaded preset is added to the currently selected voxels. When it is disabled, loading a preset replaces the current selection with the selection stored in the preset. This supports either restoring a previous selection exactly or building a selection from multiple saved regions.
The difference display itself is controlled from the View menu, but it depends on meaningful blue and red voxel selections. Define both groups before using difference spectra to compare regions.
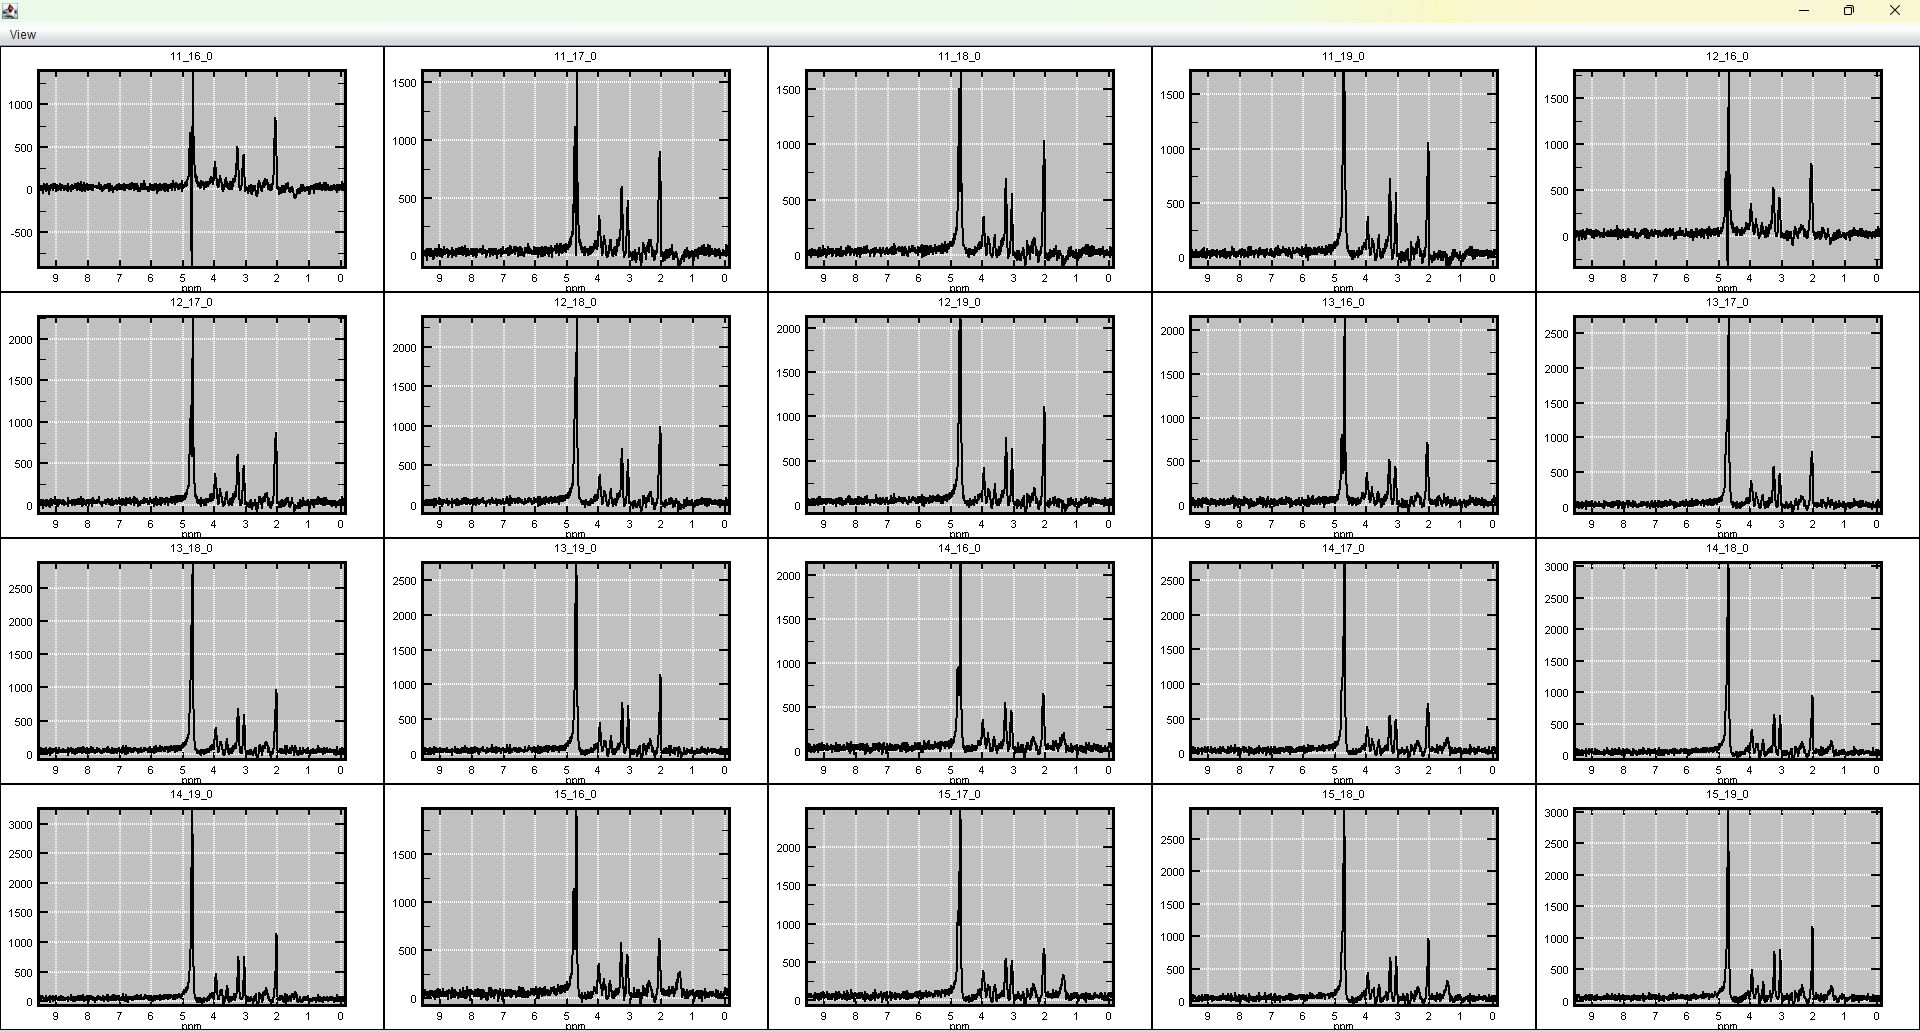
Creates a grid of XY plots for the currently selected spectra. In the example below, a blue-group selection has first been defined in the main viewer. Calling XY-plots of Selection opens a separate window with one spectrum plot per selected voxel.
This view is useful for reviewing spectral quality across a region, detecting spatially localized artifacts, comparing selected voxels, or creating an overview figure before more formal processing and quantification.
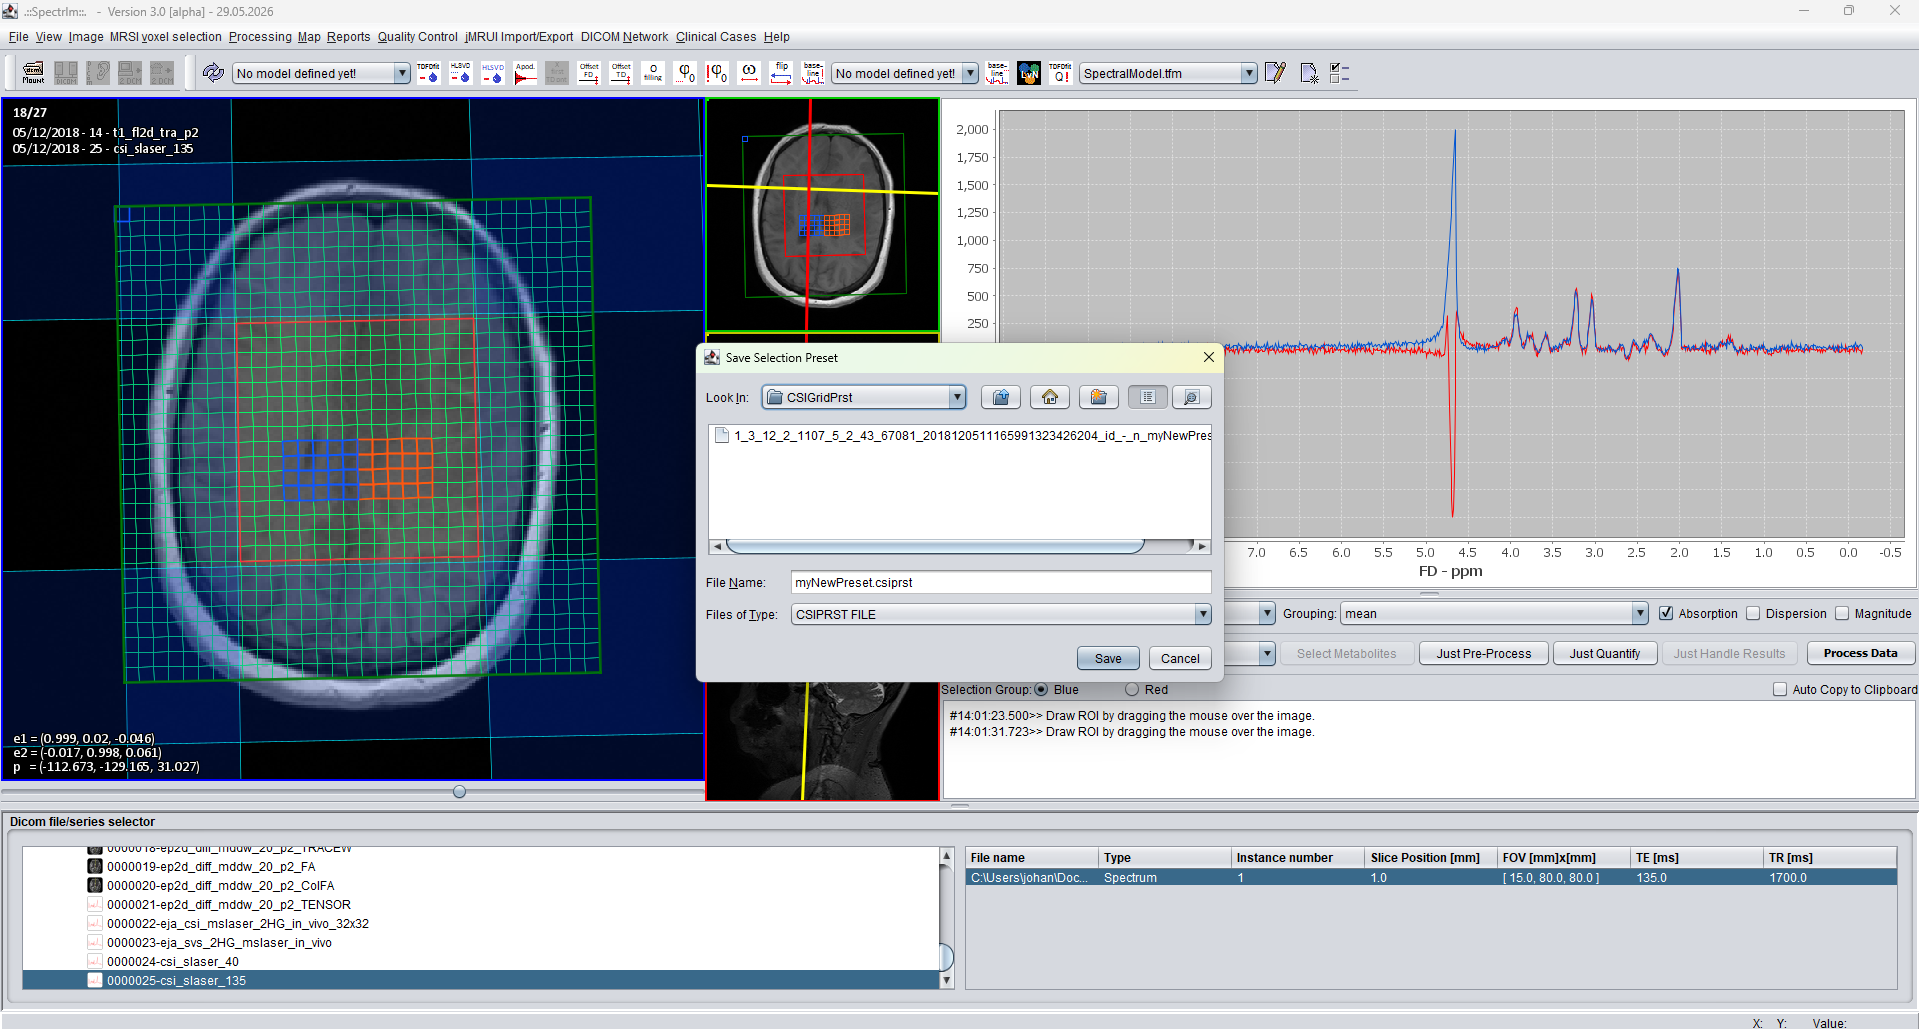
Stores the currently selected voxels of both the blue and red voxel selection groups in a preset file. This makes selections reproducible and allows regions defined during data processing to be restored later during reprocessing, comparison, or follow-up analysis.
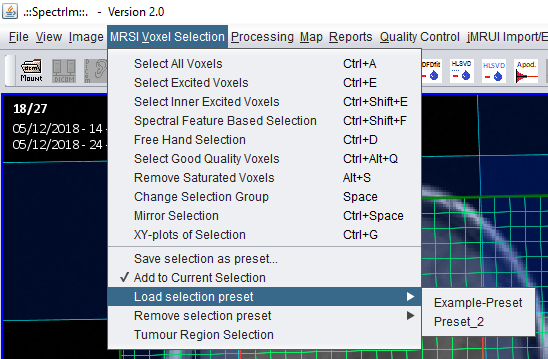
Loads a previously stored voxel selection preset. After loading the preset, the same blue and red voxel selection groups are selected and displayed again.
Depending on the Add to Current Selection toggle, the loaded preset either replaces the active selection or is added to it.
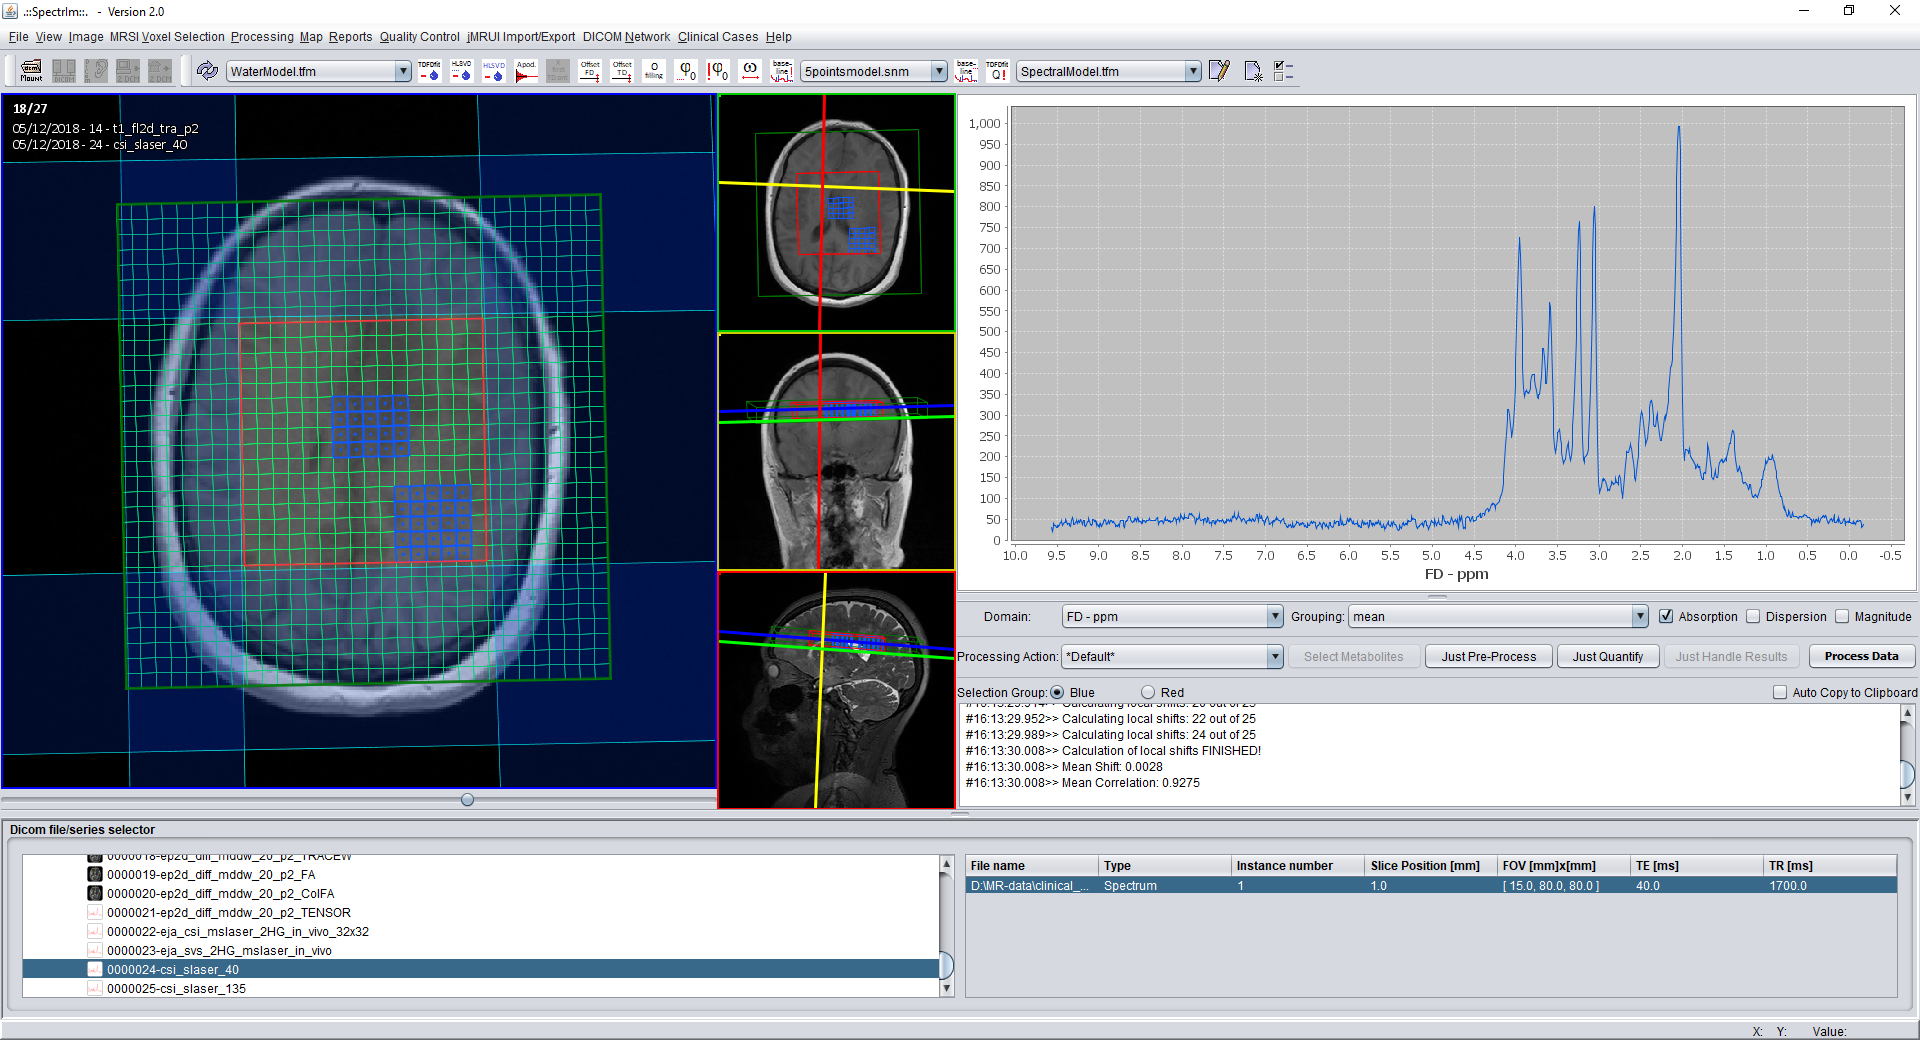
Lets the user select a stored preset and remove it from the preset list. This is useful when temporary or outdated selections should no longer appear in the preset menu.
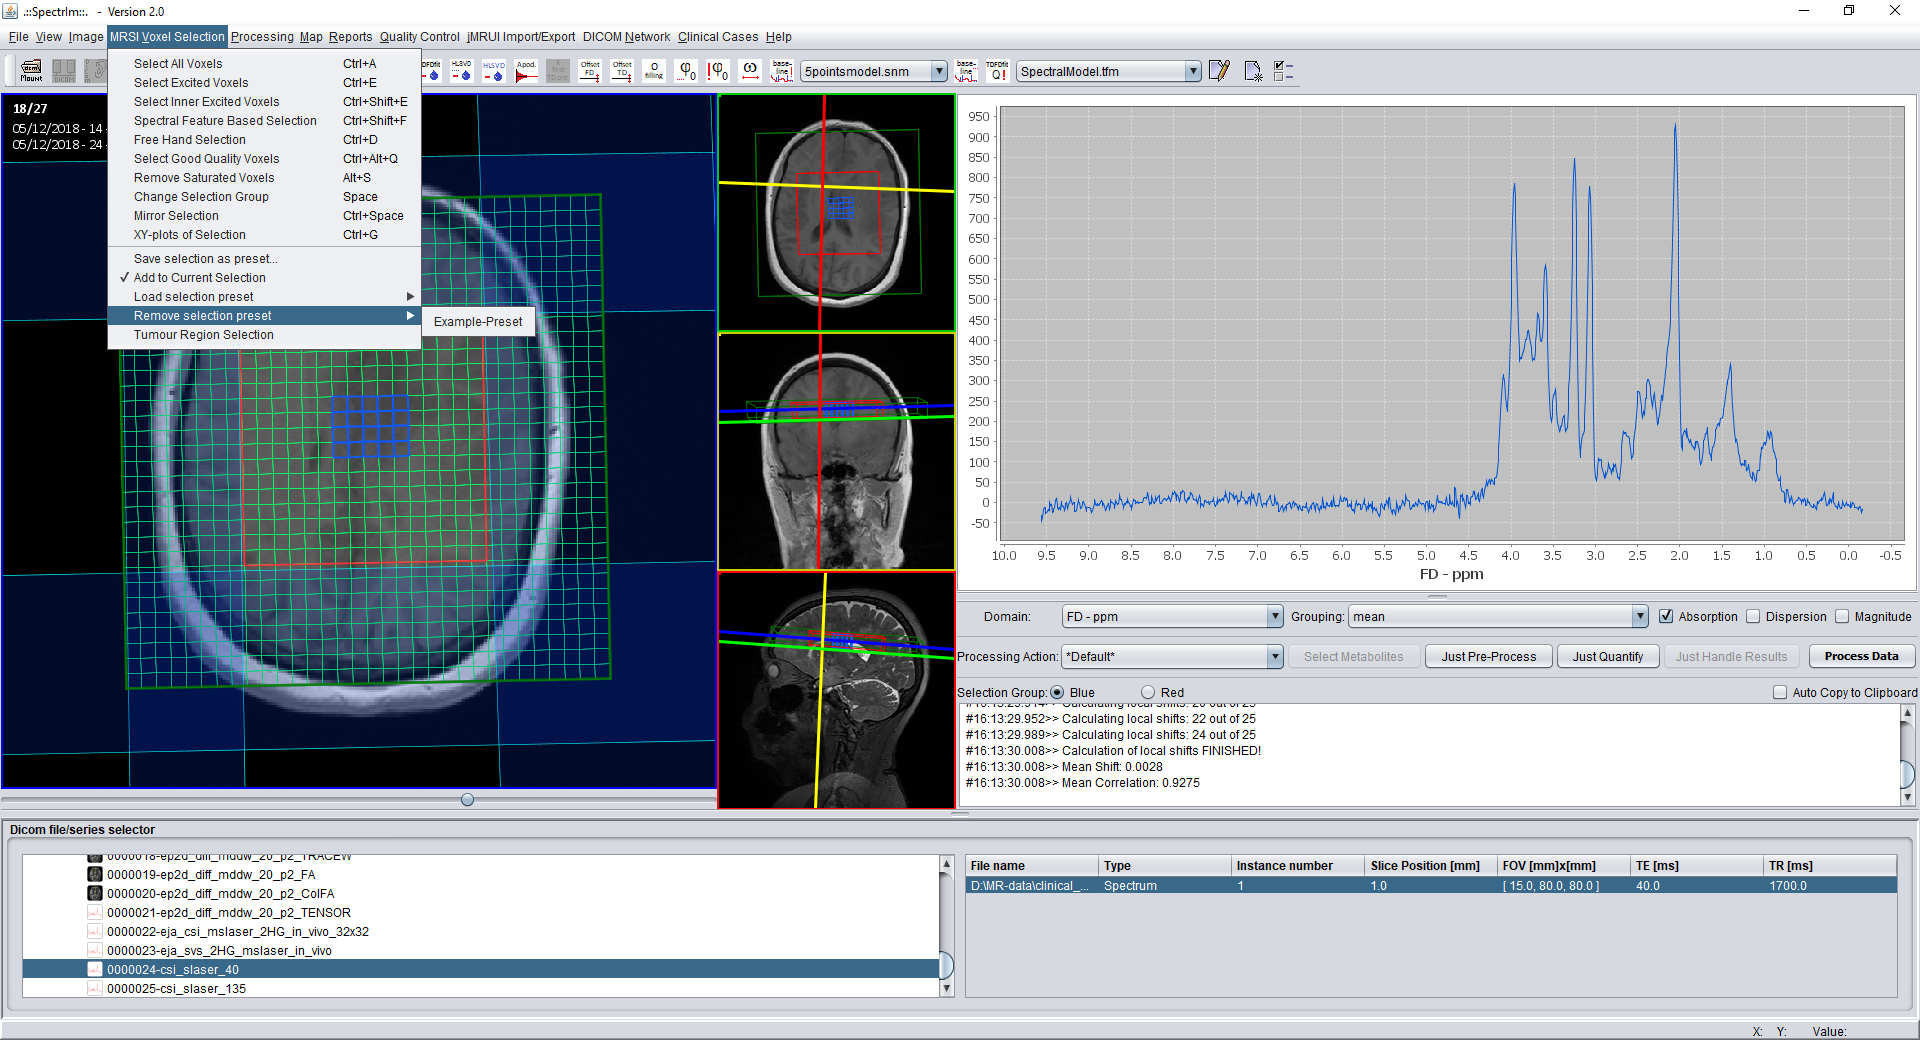
To be defined: verify the exact preset removal behavior in version 3.0.1 Alpha.
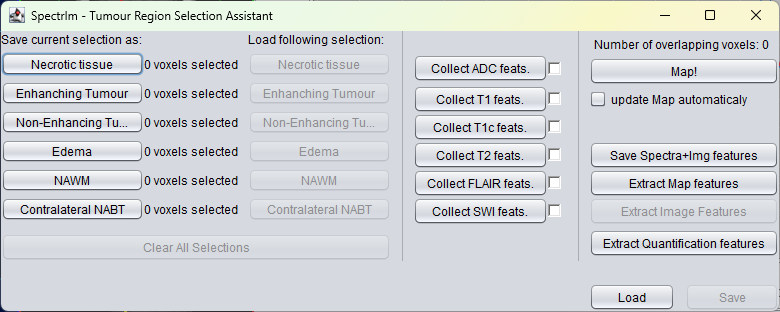
Opens the Tumour Region Selection Assistant. This tool was implemented for glioblastoma MRSI research performed with spectrIm-QMRS, where spectroscopy voxels were assigned to tumour-related tissue regions and then related to imaging and spectroscopy features.
The assistant supports saving and loading selections for necrotic tissue, enhancing tumour, non-enhancing tumour, edema, normal-appearing white matter, and contralateral normal-appearing brain tissue. It can also collect image and quantification features for later mapping or statistical analysis.
Related publication: Pedrosa de Barros N, Meier R, Pletscher M, Stettler S, Knecht U, Herrmann E, Schucht P, Reyes M, Gralla J, Wiest R, Slotboom J. On the relation between MR spectroscopy features and the distance to MRI-visible solid tumor in GBM patients. Magnetic Resonance in Medicine 80(6):2339-2355, 2018. DOI: 10.1002/mrm.27359 | PubMed PMID: 29893995
Launches the default web browser and opens the spectrIm-QMRS website directly on this MRSI voxel-selection menu documentation page.