Image menu, version 3.0.1 Alpha
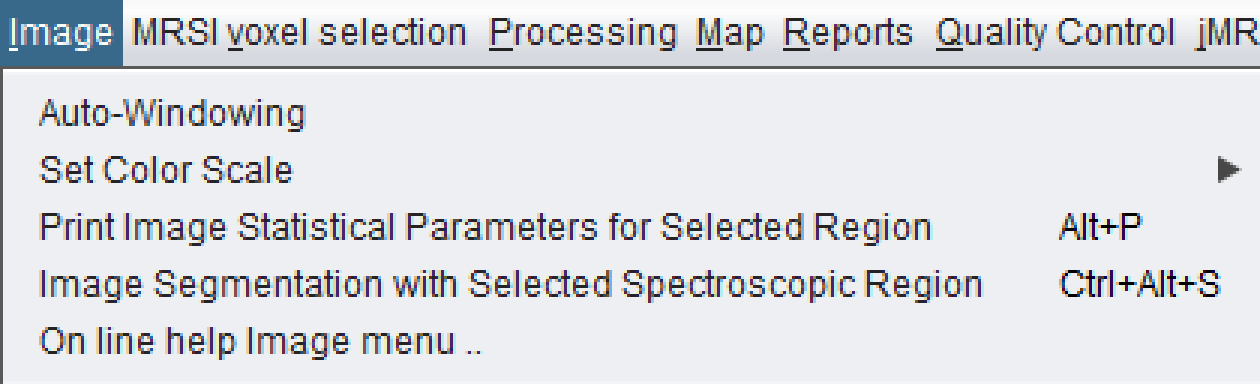
Current version 3.0.1 Alpha Image menu screenshot, cropped to show the menu itself.
 spectrIm-QMRS
Version 3.0.1 Alpha
spectrIm-QMRS
Version 3.0.1 Alpha
Clinical Viewer GUI
The Image menu contains commands for the anatomical background image on which the spectroscopy grid is displayed. These tools control windowing, color scale, image statistics, and segmentation within the selected spectroscopic region.
MRS and MRSI interpretation depends on the relationship between spectra and anatomy. The Image menu is therefore focused on the DICOM image series that provides anatomical context: how it is displayed, how its voxel-region intensities are summarized, and how simple tissue segmentation overlays can be inspected.
The current Java menu source defines the Image menu with
Auto-Windowing, Set Color Scale,
Print Image Statistical Parameters for Selected Region,
Image Segmentation with Selected Spectroscopic Region,
and the online help entry.
Current version 3.0.1 Alpha Image menu screenshot, cropped to show the menu itself.
Recomputes the displayed gray-scale window for the anatomical background image. This is useful when the loaded image series appears too dark, too bright, or poorly contrasted after loading or switching image slices.
Opens a submenu that changes how image intensities are mapped to display colors. The default display is gray levels, but several RGB ordering schemes can be used for pseudo-color visualization.
To be checked manually: the exact submenu appearance should be updated with a current version 3.0.1 Alpha submenu screenshot.
Computes statistical parameters from anatomical image pixels
intersecting the selected spectroscopy region. The current Java
source assigns the shortcut Alt+P.
Starts the interactive segmentation workflow for the anatomical
image inside the selected spectroscopy volume. The current Java
source assigns the shortcut Ctrl+Alt+S.
Opens the online help page for the Image menu. This page is the updated v3 documentation target for that command.
The current menu source lists the following color modes. These modes affect only image display; they do not change the loaded DICOM image data.
Default anatomical display mode. This is usually the clearest choice for clinical review and for judging spectroscopy grid placement over structural MRI.
Maps increasing image intensity through a red, green, and blue progression.
Inverted RGB-style progression that may emphasize high and low intensities differently from the standard RGB mode.
Alternative pseudo-color ordering for visual exploration of anatomical image intensities.
Alternative pseudo-color ordering useful when another mapping gives better visual separation of image structures.
Green-first color mapping for image display.
Green-first color mapping with red as the middle color step.
The available color modes were verified against
ClinicalViewer.java. A current v3 submenu screenshot can
be added later when convenient.
This command computes statistical parameters from the anatomical image pixels that intersect the selected spectroscopic region. The old documentation describes this as a way to relate MRI image signal properties to the selected MRS or MRSI volume.
The reported values include the number of MRI pixels, minimum and maximum pixel value, mean pixel value, standard deviation, skewness, and kurtosis. These values are useful for exploratory correlation of image intensity with spectroscopy-derived values, but should be interpreted in the context of acquisition contrast and preprocessing.
Current behavior: this command works for single voxel data and for MRSI grids. For MRSI data it does not report statistics for each individual voxel separately; instead it reports the image intensity statistics for all excited voxels together. The output is written to the red output text area of spectrIm-QMRS, where many processing and analysis messages are shown.
#10:32:59.958>> Interval 0(includes previous shift): [1.93,2.1], Previous Global Shift applied:0
#10:32:59.961>> Max found at: 2.0104
#10:32:59.962>> Peak from interval [1.93, 2.1] included! (SNR:28.4908>10)
#10:32:59.962>> New detected Global Shift: -0.0024|| increment:-0.0024
#10:33:00.148>> Calculating local shifts: 25 out of 256
#10:33:00.263>> Calculating local shifts: 50 out of 256
#10:33:00.381>> Calculating local shifts: 75 out of 256
#10:33:00.493>> Calculating local shifts: 100 out of 256
#10:33:00.604>> Calculating local shifts: 125 out of 256
#10:33:00.716>> Calculating local shifts: 150 out of 256
#10:33:00.827>> Calculating local shifts: 175 out of 256
#10:33:00.942>> Calculating local shifts: 200 out of 256
#10:33:01.053>> Calculating local shifts: 225 out of 256
#10:33:01.164>> Calculating local shifts: 250 out of 256
#10:33:01.191>> Calculation of local shifts FINISHED!
#10:33:01.191>> Mean Shift: -0.0153
#10:33:01.192>> Mean Correlation: 0.8965
#10:33:20.259>>
#10:33:20.260>> Intensity Values Statistics
#10:33:20.260>> Pixel Count    Min     Max     Mean Value      StdDev Val      Skewness        Kurtosis
#10:33:20.263>> 30114          273     816     673.91017       69.21458        -0.92462        1.26671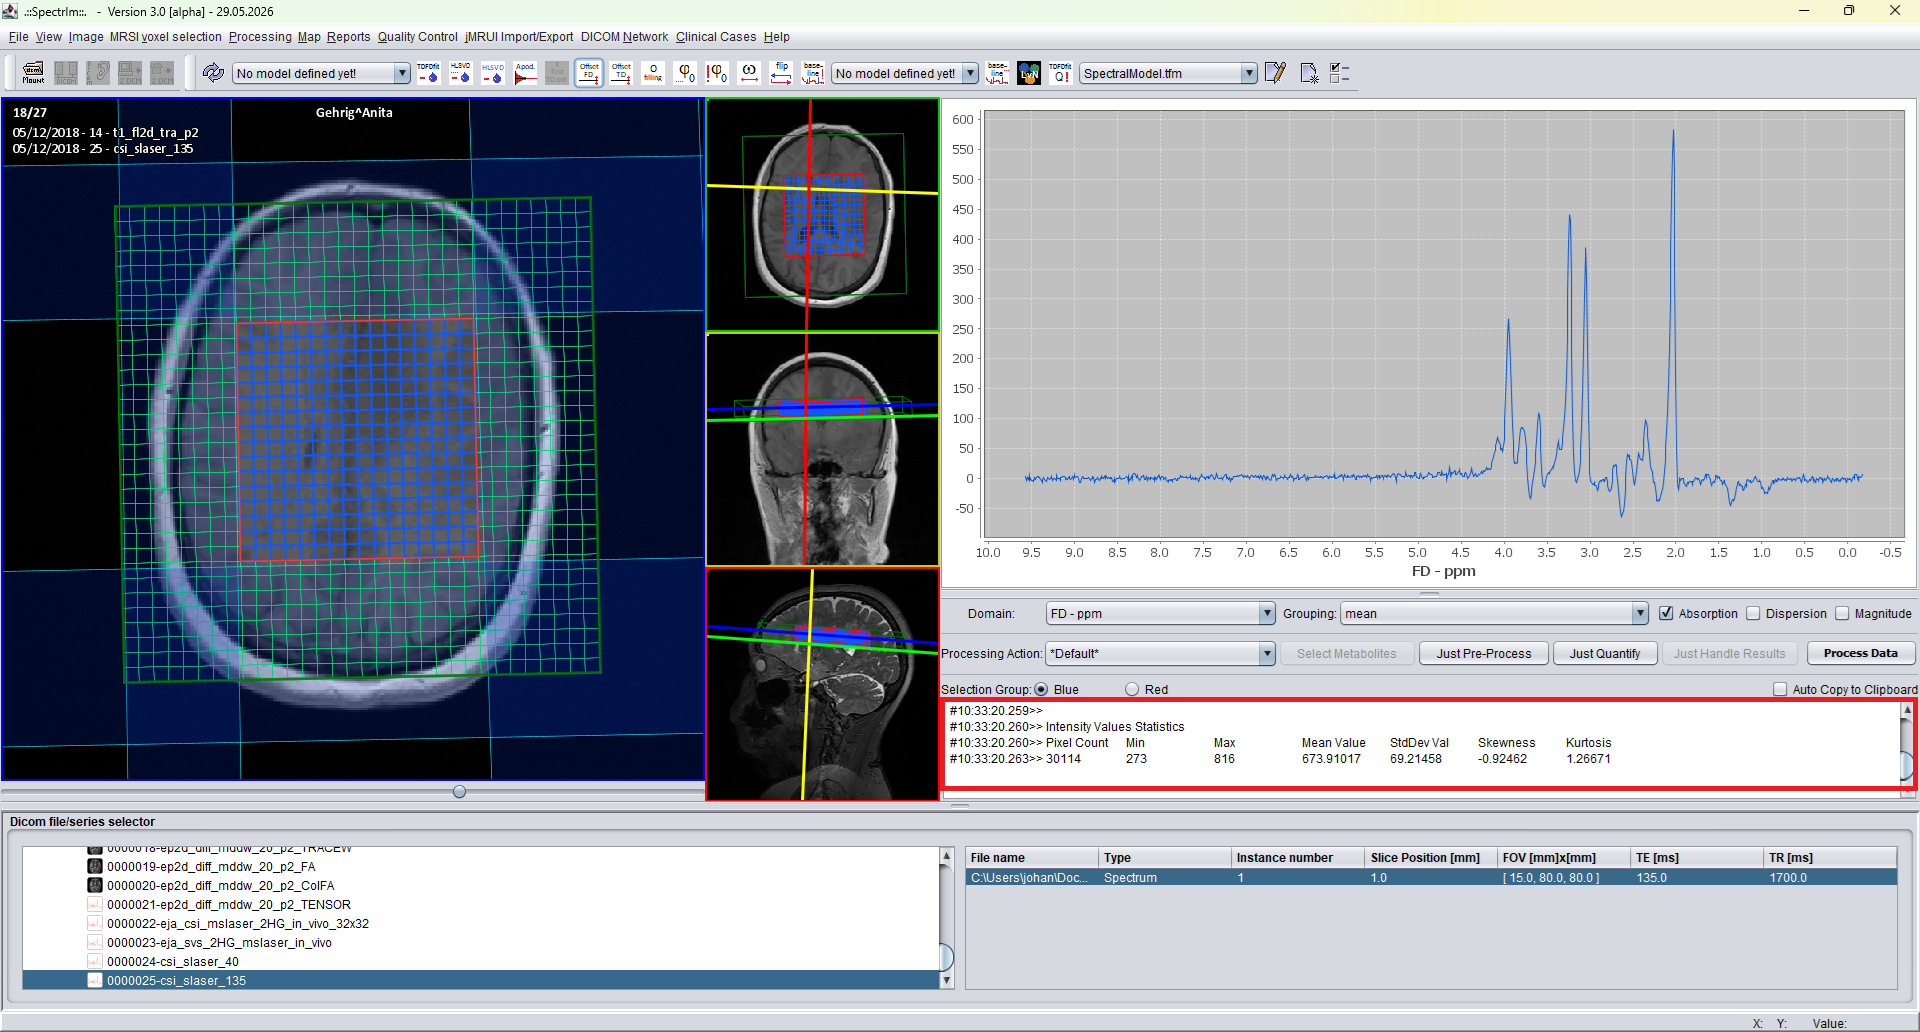
The segmentation command supports interactive segmentation of the background image within the selected spectroscopy volume. The version 3.0.1 Alpha example shows how WM, GM, and CSF thresholds can be adjusted and how the resulting overlay is inspected in the main viewer.
Segmentation-related thresholds and overlay properties can be adjusted in a dedicated control window. In the Java defaults, segmentation parameters include intensity ranges for gray matter, white matter, and CSF, display transparency, and RGB color components for each tissue class.
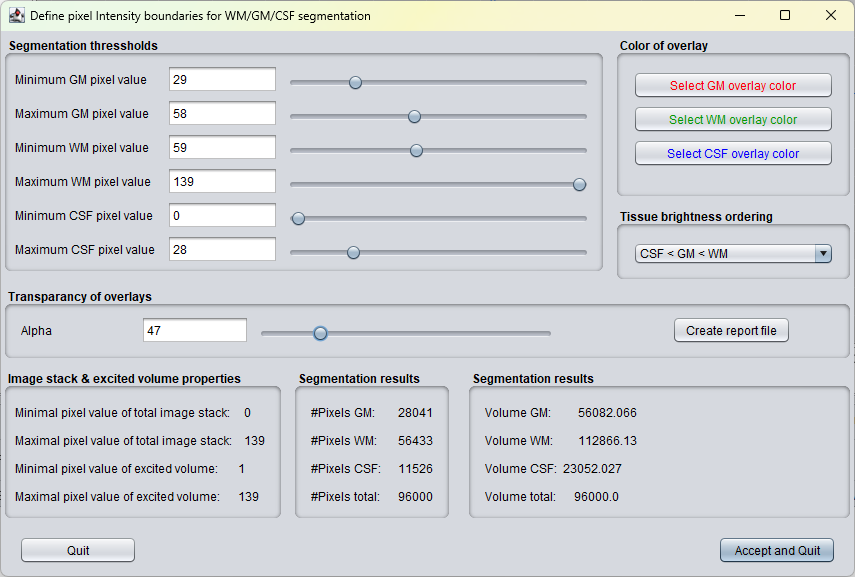
Current behavior: this interactive segmentation method is useful only when the anatomical MRI has sufficient contrast to separate white matter, gray matter, and CSF by image intensity. In brain MRI this is most plausible for high-quality structural images with strong tissue contrast, commonly T1-weighted anatomical scans; depending on the acquisition and pathology, additional contrasts such as T2-weighted or FLAIR images may be useful for specific tissue or lesion questions. Low-contrast images, strong bias fields, motion artefacts, or major pathology can make manual threshold-based segmentation unreliable.
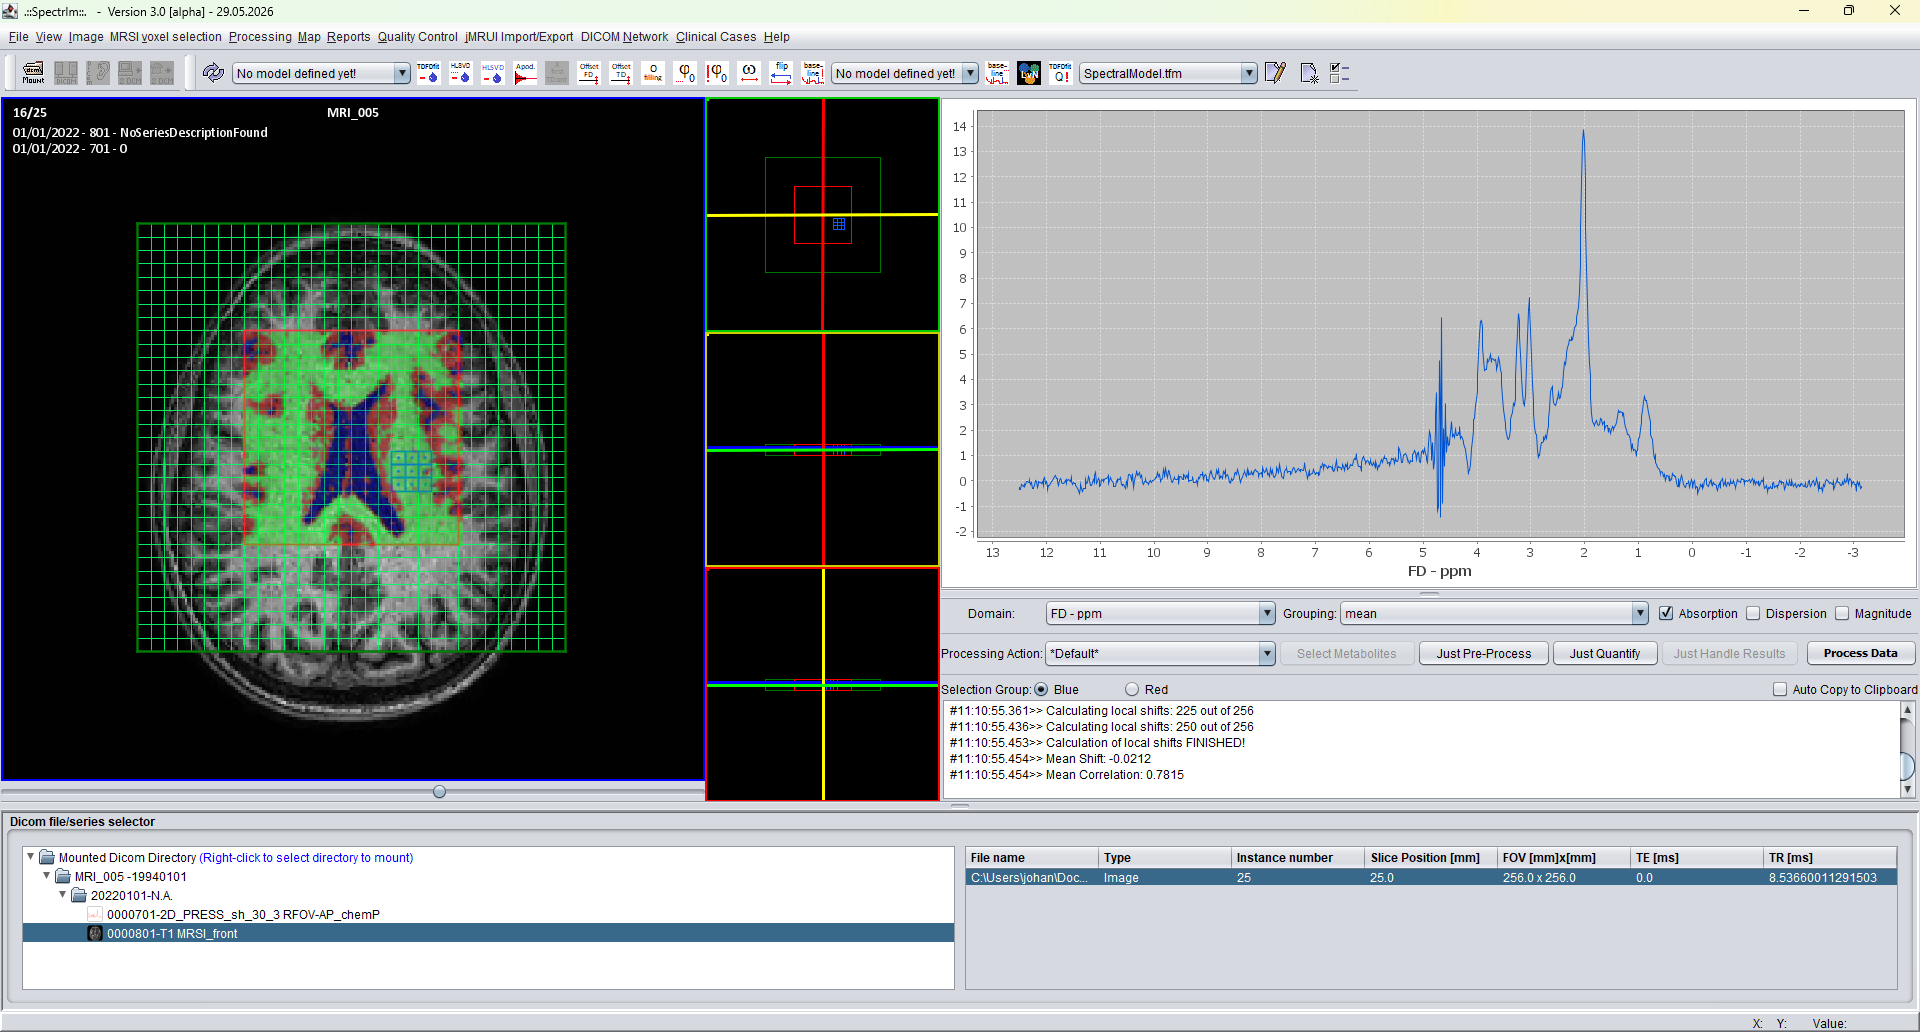
For MRSI data, spectrIm-QMRS currently reports tissue composition as a sum over all selected or excited voxels. It does not yet list white-matter, gray-matter, and CSF partial volumes for each individual MRSI subvoxel.
Report of: C:\Users\johan\Documents\Data\all_data_vanessa_02_2025\data\MRI_005\DICOM\\XX_0006
Patient name: MRI_005
Patient date of birth: 19940101
Study date: 20220101
Spectroscopic voxel size (computed): 96000.0
===========================================
Minimal GM intensity thresshold  : 29
Maximal GM intensity thresshold  : 58
Minimal WM intensity thresshold  : 59
Maximal WM intensity thresshold  : 139
Minimal CSF intensity thresshold : 1
Maximal CSF intensity thresshold : 28
===========================================
Volume of WM : 112866.13
Volume of GM : 56082.066
Volume of CSF: 23052.027
Total SVS Volume: 192000.23
===========================================
%Fraction WM : 58.78437
%Fraction GM : 29.209373
%Fraction CSF: 12.006249
===========================================
Report created by : johan on 2026-06-28 at 11:03:59 CESTThese image tools do not perform spectral quantification directly. Their purpose is to help connect spectroscopy data to anatomy: verify the selected region, inspect image intensity properties in spectroscopy voxels, and create simple tissue-overlay context for interpreting MRSI results.
For map display after fitting, see the Map menu and the workflow page on applying predefined TDFDFit models.