Quality Control menu, version 3.0.1 Alpha
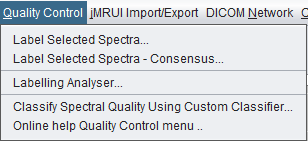
Version 3.0.1 Alpha Quality Control menu screenshot.
 spectrIm-QMRS
Version 3.0.3 Alpha International
spectrIm-QMRS
Version 3.0.3 Alpha International
Current release: 3.0.3 alpha international for Windows and Linux. This guide retains earlier screenshots and version-specific descriptions. Their original version labels are preserved; appearance and window placement may differ in 3.0.3. See the release notes.
Clinical Viewer GUI
The Quality Control menu supports manual spectrum labelling, consensus labelling, label-session analysis, and automatic spectral quality classification using a custom classifier. It is intended to make expert quality decisions reproducible across large MRSI datasets.
Manual quality control is still essential in clinical MRS(I), because spectra can be affected by residual water, lipid contamination, poor shimming, low SNR, motion, voxel misplacement, and preprocessing artifacts. The Quality Control menu lets the user label selected spectra and then use those labels for review, agreement analysis, or classifier training.
The legacy website described this menu as a tool for labelling spectra and training Random Forest classifiers to filter out poor quality spectra. That remains the central idea, but version 3.0 alpha also places quality control inside the wider processing pipeline, where classifier output can be used for quality maps and quality-threshold based selection.
The automatic classifier is not a substitute for understanding the spectra. It is a reproducible way to apply quality decisions that were first learned from expert labels. In practice it should be used with a classifier that matches the acquisition protocol, preprocessing state, echo time, field strength, and clinical or research question under investigation.
Version 3.0.1 Alpha Quality Control menu screenshot.
Starts a labelling session for the currently selected spectra. The application steps through the selected voxels, displays the corresponding spectrum, and asks the user to assign a quality label. During this process the active voxel is selected in the image viewer so the spectral label remains connected to its spatial position.
The labelling handler extracts spectral quality features for each selected voxel and stores the session information together with patient, study, and series context. These labels can later be reviewed in the labelling analyser or used to train a classifier.
Internally, the selected voxels are visited in grid order. For quality labelling, spectrIm-QMRS computes the same spectral quality feature vector that is later passed to the automatic classifier. The active voxel is highlighted while the labelling popup asks for the expert decision, so the spectrum, image position, and stored label remain tied to the same coordinate.
Starts a consensus labelling workflow. This mode compares a new labelling session with a reference labelling file, making it useful when several raters annotate the same spectra or when a project needs agreement with an established reference set.
Consensus labelling is especially relevant for building robust quality-control datasets. It helps separate genuine spectral quality problems from subjective differences between raters.
Opens the labelling session analyser. The analyser can load labelling files, list sessions, show patient/study/series information, count labelled voxels, and summarize values such as the mean label value and standard deviation per session.
This view is useful for checking whether a labelling campaign is balanced, whether raters used the same classes consistently, and whether enough labelled spectra are available before training or validating a classifier.
Labelling files use the .lbls extension. The
analyser can load one or more labelling-session files, refresh
the session overview, and remove selected sessions when a
labelling attempt should not be kept. The table records the
session file, patient, study, series, start date and time,
duration, number of labelled voxels, mean label value,
standard deviation, and storage location.
The analyser also reports the number of used label classes and the actual class values found in the loaded sessions. This is useful before classifier training, because imbalanced labels or unexpected class values can otherwise silently reduce the usefulness of the training set.
To be defined: add a current screenshot of the Labelling Analyser window.
Applies a user-selected quality classifier to the loaded MRSI
spectra. The classifier file is selected through a file chooser
and is expected to be an .RData file. The output is
stored as spectral quality scores and can be mapped or used in
downstream quality-based selection.
The current implementation writes the spectral-quality feature table of the selected spectra to a temporary CSV file, loads the selected R Random Forest model, and asks the model for the class-2 probability. In this context the score is interpreted as the estimated probability that a rater would accept the spectrum. Scores are stored per voxel and can be displayed as a quality map or used by selection and processing actions.
Version 3.0.1 Alpha checks several prerequisites before
classification: an Rscript.exe path must be
configured in Settings > Other, the frequency-domain
signal-free region must be valid for the current spectrum, a
valid .RData classifier file must be supplied, and
the required R packages, randomForest and
Runiversal, must be available in the user
Documents/R library path.
In processing actions, classifier output can be combined with a quality threshold. This makes it possible to keep only spectra whose predicted quality exceeds the configured threshold, while still keeping the quality map available for review.
To be checked manually: document which validated classifier files are distributed or recommended for version 3.0.1 Alpha. Until this is defined, classifier files should be treated as project- and protocol-specific.
The automatic quality-control workflow is related to the work by Pedrosa de Barros, McKinley, Knecht, Wiest, and Slotboom on automatic quality control in clinical proton MRSI of brain cancer. The formal citation and related quality-management references are collected on the Citing spectrIm-QMRS page.
In Nuno Pedrosa de Barros' thesis, the Random Forest quality classifier was deliberately trained on compact spectrum-derived descriptors rather than on every individual spectral data point. This was done to capture robust information about spectral quality while reducing sensitivity to small spectral misalignment, temperature or pH related shifts, and irrelevant details of individual spectra.
The current spectrIm-QMRS feature table contains 47 features. They include maximum peak SNR and mean SNR in frequency-domain ranges covering lipid, lactate, NAA, Glx, creatine, choline, and residual-water/lipid regions; global frequency-domain SNR descriptors and ratios; TD and FD maximum, mean, standard deviation, skewness, and kurtosis; TD mean SNR in 25 ms intervals from 0 to 200 ms; and TD relative-change features in the same time intervals.
These feature families are also exposed elsewhere in the application as spectral feature maps. They can therefore be used interactively for voxel selection, and they can also serve as input variables for automatic MRS(I) quality filtering when a suitable classifier is available.
The old Quality Control help page referenced the common spectrIm and
EU project logos but did not include menu-specific screenshots. The
referenced legacy images have been copied into
assets/img/legacy/quality-control for traceability.