SLOW-EPSI combines spectral editing with an echo-planar spectroscopic
imaging readout, making it possible to inspect edited metabolite maps
in a spatially resolved MRSI dataset. In spectrIm-QMRS this page is
intended as the starting point for learning how to load, view, and
process SLOW-EPSI example data on a local PC.
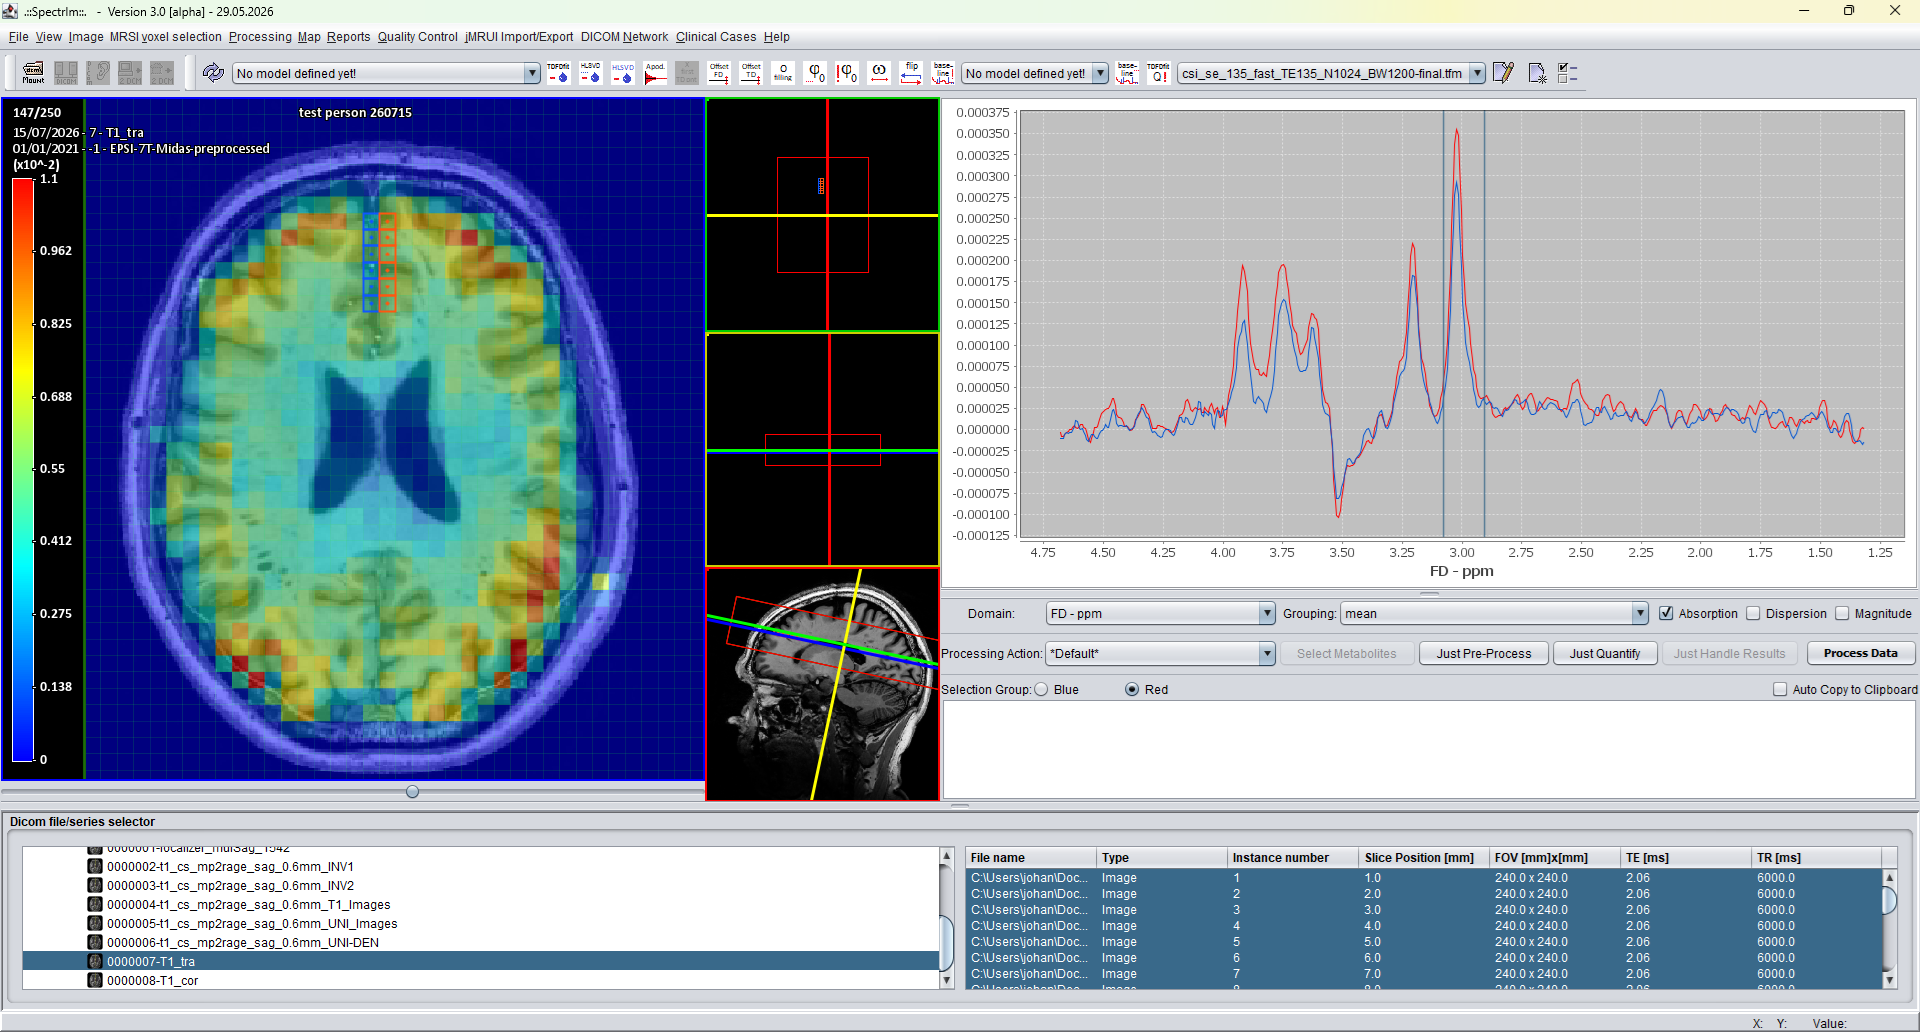
SLOW-EPSI dataset displayed in the spectrIm-QMRS Clinical Viewer on
top of the anatomical T1-weighted image stack acquired on a Terra 7T
scanner, with MRSI map overlay, selected voxels, and linked spectrum
display.
Technique in brief
SLOW stands for SLOtboom-Weng editing. The original work introduced
SLOW as a spectral-editing strategy for whole-brain MRSI at ultra-high
field, using chemically selective adiabatic refocusing pulses in an
EPSI framework. The design was motivated by the need to perform
spatially resolved editing of coupled resonances while retaining broad
anatomical coverage and manageable acquisition times.
The technique was originally developed for ultra-high-field MRSI at 7T,
but the sequence is now also available for 3T use. This is important
clinically, because 3T systems are much more widely available than 7T
scanners. With suitable acquisition and reconstruction, high-resolution
GABA/Glx mapping can also be performed at 3T.
spectrIm-QMRS does not replace the sequence reconstruction pipeline.
Instead, it provides the clinical viewer, grid overlay, spectrum display,
voxel selection, preprocessing, modelling, and quantification environment
in which reconstructed SLOW-EPSI data can be inspected and analysed.
Example dataset downloads
This page provides separate SLOW-EPSI downloads for different use cases.
Most spectrIm-QMRS users should start with the preprocessed, ready-to-view
example package. The raw scanner-data archive is much larger and is intended
for users who want to reproduce the MATLAB reconstruction route. The files
are served from a NAS server in Switzerland, so especially the raw-data
download may take a long time. Faster mirror links will be added later when
the same archives have been uploaded to higher-bandwidth servers.
Preprocessed spectrIm-QMRS example
The preprocessed example contains MATLAB-reconstructed SLOW-EPSI
spectra and DICOM grid-definition data that can be loaded directly
in spectrIm-QMRS for viewing, voxel selection, map display, and
further analysis.
SLOW_EPSI-Data-4-spectrIm-QMRS.zip, approx. 454.8 MB
(433.7 MiB). This is the recommended first download for users who
want to learn the spectrIm-QMRS workflow without reconstructing the
scanner raw data first.
Raw SLOW-EPSI data and MATLAB reconstruction scripts
The raw Terra 7T SLOW-EPSI scanner data are provided for users who
want to reproduce the reconstruction route. At present, SLOW-EPSI
cannot yet be reconstructed directly on the Terra scanner, so the
reconstruction is performed with MATLAB routines before the resulting
spectroscopy files are loaded into spectrIm-QMRS.
The raw scanner data therefore require the MATLAB reconstruction
scripts before they become ready-to-load spectrIm-QMRS spectroscopy
files.
SLOW_EPSI_Example_RawData.zip, approx. 13,535.0 MB
(12,908.0 MiB). This is a very large archive; please expect a long
download time from the current NAS server. Faster mirror downloads
will be added later.
Processing pipeline video
The following video walks through processing a raw SLOW-EPSI dataset with
MATLAB reconstruction and subsequent loading, viewing, and inspection in
spectrIm-QMRS. It is intended as a practical companion to the raw-data and
ready-to-view example downloads below.
SLOW-EPSI processing pipeline: raw scanner data are reconstructed with
MATLAB scripts and then inspected in spectrIm-QMRS. Video size: approx.
37.8 MB (36.0 MiB). Download video.
Folder structure
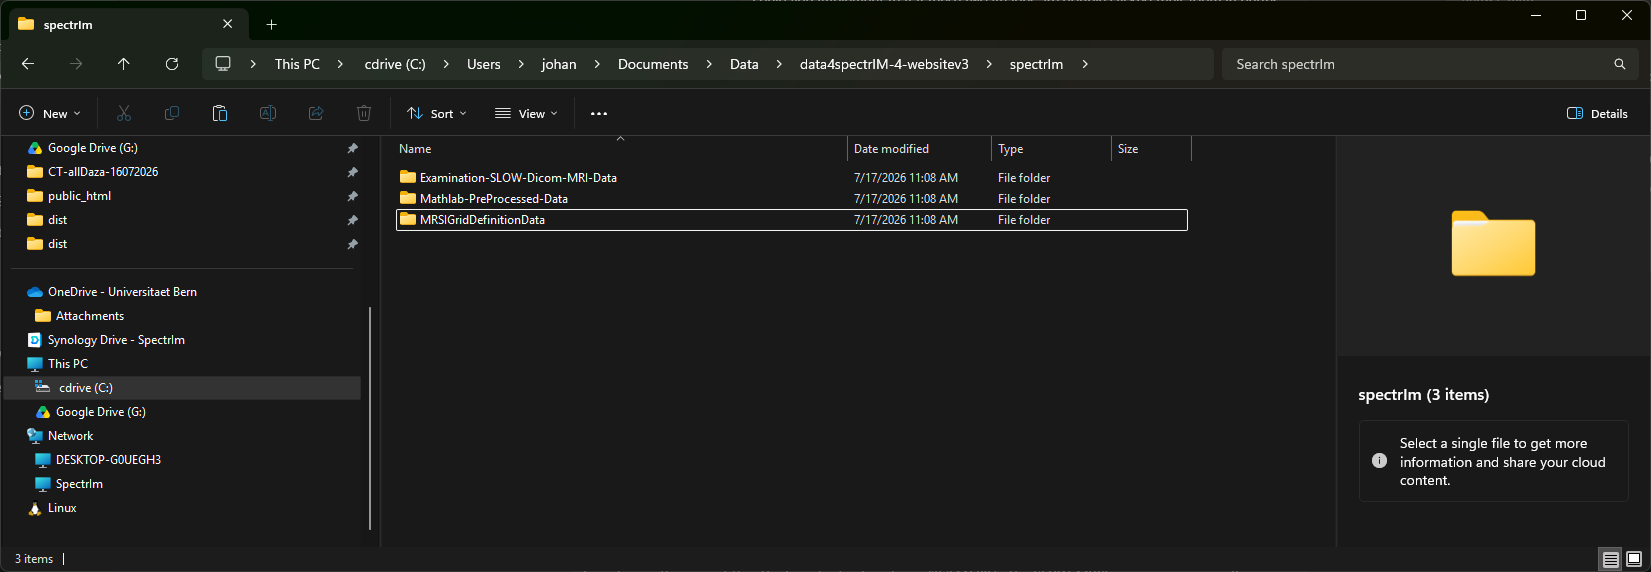
The ready-to-view example dataset is organized into three top-level folders.
This structure separates structural MRI images, reconstructed SLOW-EPSI
spectroscopy files, and empty DICOM objects that define the MRSI voxel
grid for spectrIm-QMRS.
Example SLOW-EPSI ready-to-view dataset folder structure: structural
MRI images, MRSI dummy DICOM grid-definition objects, and reconstructed
spectroscopy files.
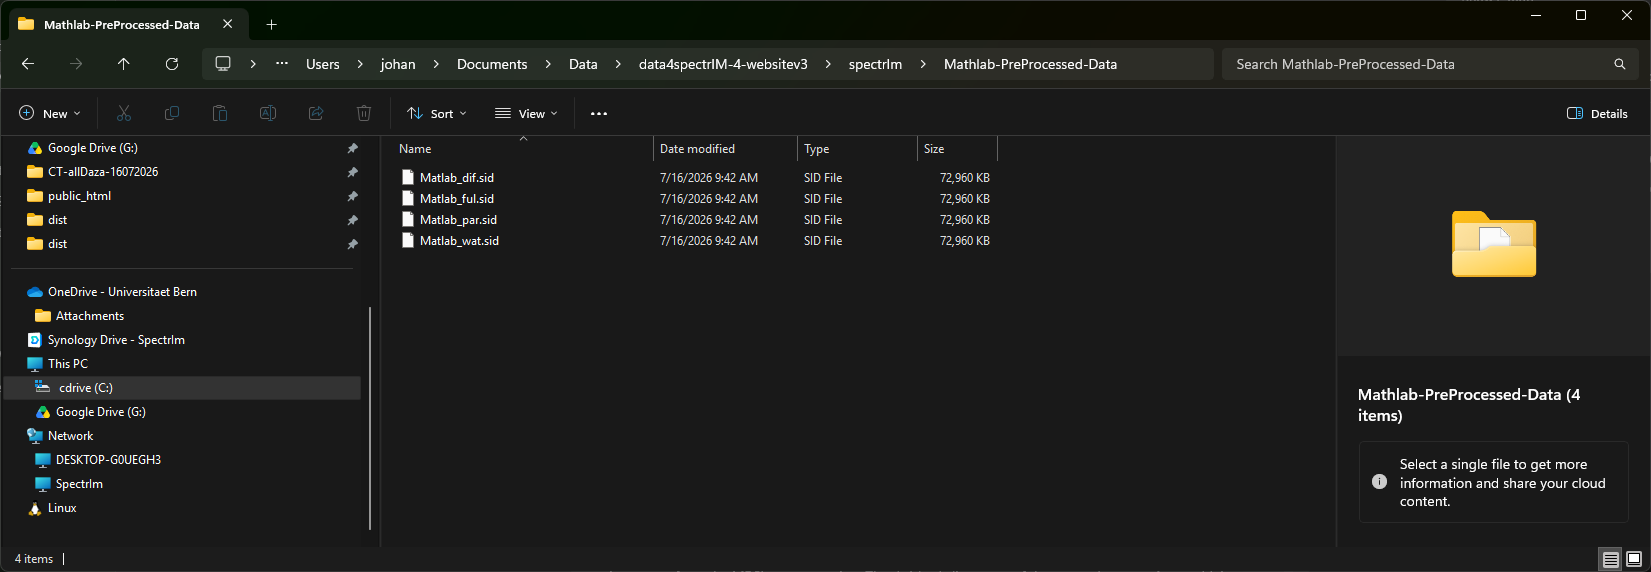
MATLAB-preprocessed spectroscopy files
The MATLAB-preprocessed folder contains spectroscopy files that can be
loaded in spectrIm-QMRS. These files represent the reconstructed SLOW-EPSI
output rather than raw scanner data. They allow users to focus first on
viewing, selecting voxels, inspecting spectra, and preparing analysis
steps inside spectrIm-QMRS.
MATLAB-preprocessed SLOW-EPSI files: Matlab_ful.sid
for SLOW-full, Matlab_par.sid for SLOW-partial,
Matlab_dif.sid for the SLOW-difference spectrum, and
Matlab_wat.sid for the water reference.
How spectrIm-QMRS uses the three folders
Structural MRI images
The MRI folder contains structural images of the subject
from the examination in which the SLOW-EPSI acquisition was recorded.
These images provide the anatomical background onto which spectrIm-QMRS
can draw the MRSI grid and spectroscopy-derived maps.
Reconstructed spectroscopy files
The xfData_filtered folder contains reconstructed SLOW-EPSI
spectroscopy files. These are the spectroscopy datasets that can be
opened, viewed, and analysed directly in spectrIm-QMRS.
MRSI dummy DICOM grid data
The MRSIDummyDicom folder contains empty DICOM images with
the dimensions, positions, and slice information of the spectroscopy
voxels. These DICOM objects define the spatial MRSI grid and allow
spectrIm-QMRS to draw that grid on top of the structural MRI data.
Recommended first workflow
Start with the reconstructed spectroscopy files in xfData_filtered
and the grid-definition objects in MRSIDummyDicom. Once these
load correctly, add the structural MRI image stack from MRI so
that the SLOW-EPSI grid and maps can be inspected in anatomical context.
SLOW modelling in the current alpha
The current spectrIm-QMRS alpha connects the reconstructed
SLOW-FULL, SLOW-PARTIAL, and SLOW-DIFFERENCE datasets to the ILV
basis-set simulator and TDFDFit model creation workflow. ILV can
generate complete metabolite basis spectra and resonance-group
components with compact filenames, making it easier to build
subtle prior-knowledge models for edited SLOW spectra.
This is especially useful for metabolites whose coupled spin
systems do not behave as one perfectly rigid basis component in a
difference spectrum. A model can keep the complete metabolite
spectrum, replace it by selected resonance-group components, or
combine both approaches during expert model development.
For regional clinical interpretation, selected voxels can also be
fitted as one summed spectrum with ΣQ!. The
named summed region can later be reopened with
Σ?, which restores the selected voxels and
displays the stored fitted result.