Reports menu, version 3.0.1 Alpha
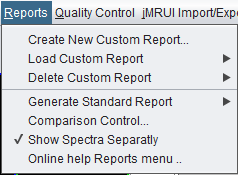
Current version 3.0.1 Alpha Reports menu screenshot.
 spectrIm-QMRS
Version 3.0.1 Alpha
spectrIm-QMRS
Version 3.0.1 Alpha
Clinical Viewer GUI
The Reports menu converts fitted MRS(I) results, selected spectra, metabolite maps, anatomical localizers, and comparison tables into structured report views. It is the bridge between interactive analysis and a presentation-ready summary of the findings.
In spectrIm-QMRS, reports are generated from the currently loaded dataset and the available quantification results. If TDFDFit results have been loaded or computed, the report tools use the TDFDFit result store. In legacy jMRUI-linked workflows, the same report framework can use jMRUI-style quantification results.
Reports are especially useful after voxel selection and fitting: the blue and red selection groups can be used to summarize different regions, compare suspicious and reference tissue, or create reproducible figures for research documentation.
Current version 3.0.1 Alpha Reports menu screenshot.
Opens the custom report frame. A custom report can be assembled from report panels such as metabolite maps, metabolite ratio maps, spectra from the blue and red selection groups, overview panels, metabolite tables, and localizer panels. The report can therefore be adapted to a specific clinical question or research protocol.
Custom reporting requires a loaded dataset with image context. When TDFDFit results are available, the report can use those quantitative results directly. Otherwise the legacy jMRUI result interface is used where applicable.
Inside the custom report window, right-clicking an empty report cell provides the building blocks for the layout: split the cell horizontally or vertically, insert a red-group, blue-group, or combined spectra panel, add horizontal or vertical localizer panels, add an overview panel, add a metabolite table, or insert a metabolite map or metabolite-ratio map. The available metabolite names are taken from the current quantification result store.
Loads a previously saved custom report preset. Presets are
stored as .rprst files and appear as submenu items
under Load Custom Report. This makes it possible to reuse a
reporting layout across patients, projects, or teaching cases.
In version 3.0.1 Alpha the submenu is populated dynamically by
scanning the report preset folder for files ending in
.rprst. By default this folder is
.SpectrImClinicalQMRS/ReportPrst inside the
spectrIm runtime data directory. The folder can be changed in
the application settings, where the report output folder can
also be configured.
A custom report frame also contains its own
Save as preset... and Load preset...
commands. Saving a preset records the report layout tree and
the selected metabolite or metabolite-ratio map names, not the
patient data themselves.
Screenshot still needed: Load Custom Report submenu with one or
more saved .rprst presets.
Removes a saved custom report preset. The available presets are
shown as submenu items, and selecting one deletes the matching
.rprst file from the report preset directory.
This command only affects the saved layout preset. It does not delete spectroscopy data, image data, fitted results, or report images that have already been exported.
A custom report can include a metabolite table next to the overview image and spectra panels. The table summarizes the same blue and red voxel groups that are visible in the Clinical Viewer and in the report overview panel. This makes the report suitable for direct comparison of two regions, for example tumour infiltration and contralateral normal tissue.
For TDFDFit results, the table reports the mean metabolite Area over the selected voxels, with the standard deviation of the selected voxel values. This matches the interactive metabolite maps when the map popup is set to the same metabolite and the Area feature. The signed fitted amplitude is not used for the clinical summary table, because phase/sign conventions can make fitted amplitudes negative although the displayed area map is positive.
When both selection groups are present, the table shows three quantitative columns: blue, red, and all selected voxels. Ratio rows such as Cho/Cr and Cho/NAA are calculated from the same group means, so the numbers correspond to the regions shown in the report.
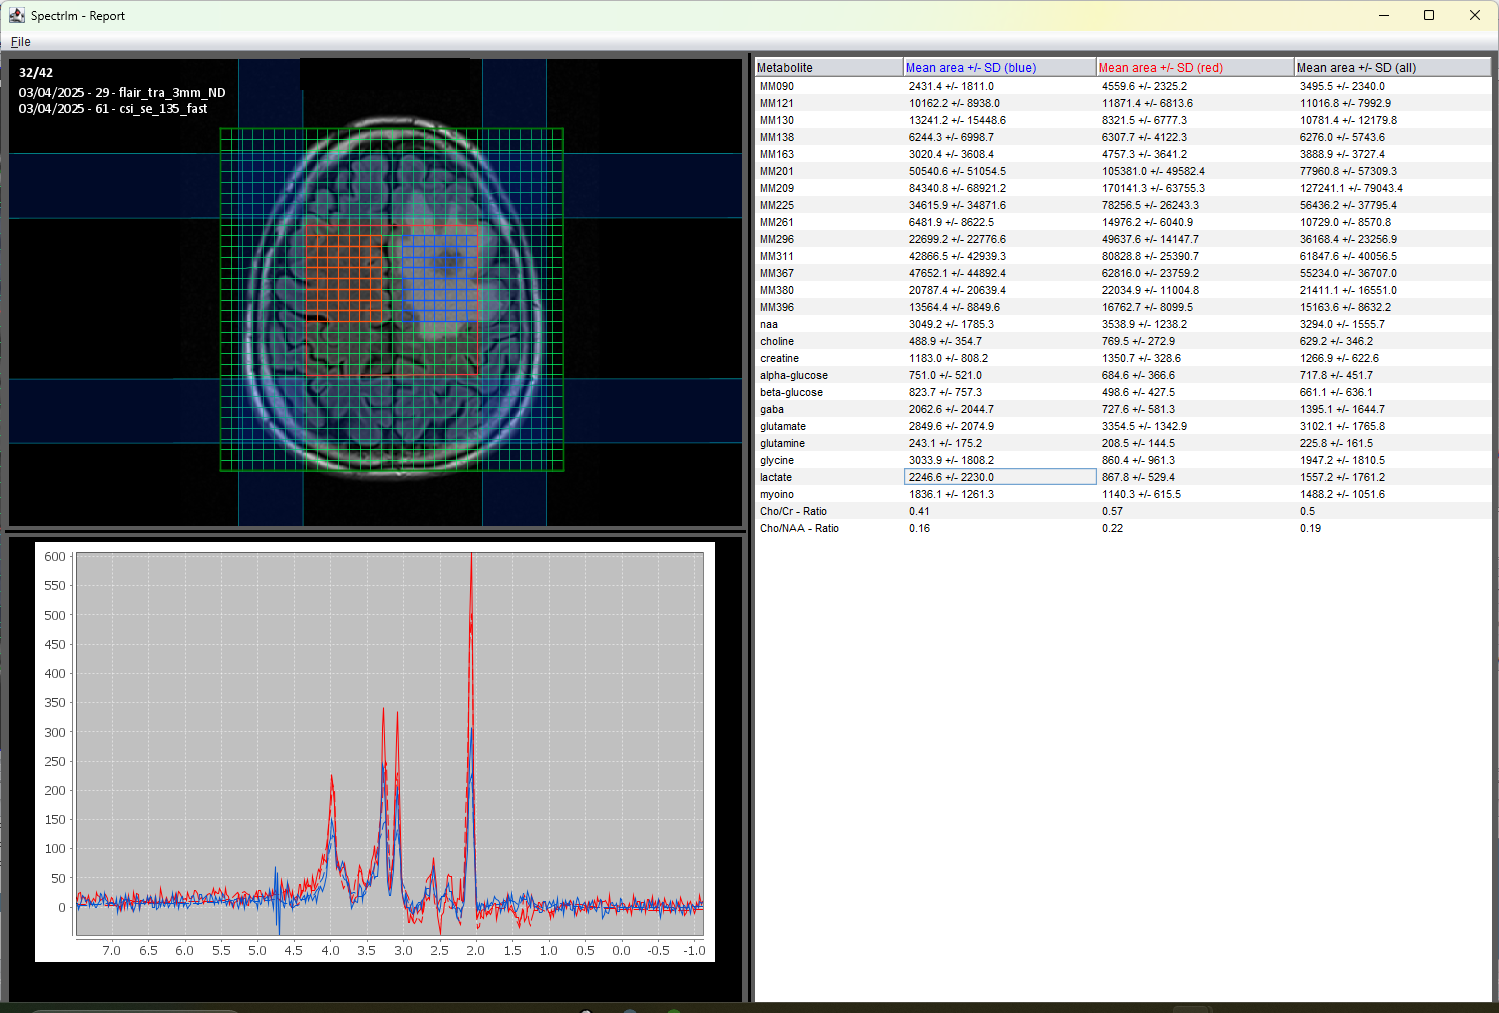
The report table was verified against the Clinical Viewer map workflow. In the Clinical Viewer, a metabolite map such as NAA Area is generated from the TDFDFit result store by reading the per-voxel Area feature. The custom report table now uses the same Area feature and the live blue and red voxel selections from the loaded dataset.
This avoids a confusing older behaviour where the table could display signed fitted amplitudes while the Clinical Viewer map displayed positive Area values. It also avoids stale table columns when a report is edited or a preset is loaded again.
Opens a submenu for predefined report layouts. These standard layouts are intended for common reporting tasks where the user does not need to build a report manually.
Generates the standard metabolite-map report. In the current source code, this report displays the principal metabolite maps for Choline, NAA, and Creatine in a predefined panel layout. The report is available for MRSI datasets with more than one grid position and requires available quantification results.
This report is useful as a first quantitative overview after fitting, because it presents the spatial distribution of the major metabolites in a consistent format.
The standard report frame uses the same map-listener interface as the interactive map display. In current version 3 workflows this will normally be the TDFDFit result store. For older workflows, the report infrastructure still contains the legacy jMRUI result pathway.
Opens the comparison report for the blue and red voxel selection groups. This workflow is designed for comparing two spatial regions, for example a lesion and contralateral tissue, enhancing and non-enhancing regions, or any two manually defined MRSI selections.
The command requires an MRSI dataset and both blue and red selection groups to be defined. If either group is missing, the application prints guidance in the output area: define a blue and a red selection, use Space to change the active selection group, Ctrl for additive selection, and Ctrl+Space to mirror the current selection into the other group.
Toggles how spectra are displayed in comparison reports. When enabled, spectra from the compared selections are shown separately, which makes group-specific spectral differences easier to inspect. When disabled, the report can use a more compact display.
The current Java label contains the spelling
Show Spectra Separatly; the website uses the
corrected spelling while preserving the meaning of the menu
item.
Report frames include a small File menu in the report window.
The current Java implementation provides three export commands:
Export to PNG..., Export to Dicom file,
and Export to Dicom and sent to Dicom node ....
PNG export captures the report panel as a raster image and
writes it as a .png file. DICOM export first
renders the report as an image and then uses the current DICOM
study context to write a secondary DICOM object. The DICOM
network option opens the configured DICOM node selection dialog
and sends the captured report image to the chosen node.
The broader clinical motivation for DICOM formatted MRS(I) output is described in the DICOM crash course.
Batch-processing support currently creates the standard
metabolite-map report and writes the rendered report panel to
the requested output file. The batch interface already defines
report output modes for PNG and DICOM, but the present
ClinicalViewer.createReport implementation writes
the rendered image as PNG.
Screenshot still needed: report-frame File menu showing PNG, DICOM file, and DICOM network export commands.
The old website page at this filename mostly described map menu functions such as color scale selection and image segmentation. Those topics belong on the Map menu page. The current Reports page has therefore been rewritten around the actual version 3.0 alpha Reports menu and the report classes in the Java source.
The old Reports help page referenced the common spectrIm and EU
project logos but did not include report-specific screenshots.
The referenced legacy images have been copied into
assets/img/legacy/reports for traceability.