Current release: 3.0.3 alpha international for Windows and Linux. This guide retains earlier screenshots and version-specific descriptions. Their original version labels are preserved; appearance and window placement may differ in 3.0.3. See the release notes.
Workflow tutorial
Quick overview: download sample data and load it into spectrIm-QMRS
This page ports the old quick-overview video into the new version 3 website structure. It is intended as a first practical walkthrough: download one of the anonymized example DICOM datasets, extract it, mount the directory, and load image and spectroscopy data into the Clinical Viewer.
Legacy walkthrough video
The video below is preserved from the previous website. It remains useful for understanding the basic idea of downloading sample data and loading it into spectrIm-QMRS, but the visual details should be checked against the version 3.0.1 Alpha GUI and the updated self-contained package workflow.
Legacy tutorial video: downloading DICOM sample data and loading it into spectrIm-QMRS. Preserved for review and gradual replacement by a current version 3 still-image walkthrough.
Step 1: download an example dataset
Start from the example DICOM datasets page. The Siemens archive is smaller and is a good first test. The Philips enhanced DICOM archive is larger and useful for checking the Philips loading route.
Download the ZIP once and extract it into a local data directory. Do not try to mount or open the dataset directly from inside the compressed ZIP archive.
Step 2: mount the extracted DICOM directory
In spectrIm-QMRS, choose File > Mount directory... and select the folder that contains the extracted DICOM examination. The Patient/Study Browser scans the directory tree and builds a patient, study, series, and instance hierarchy from the DICOM metadata.
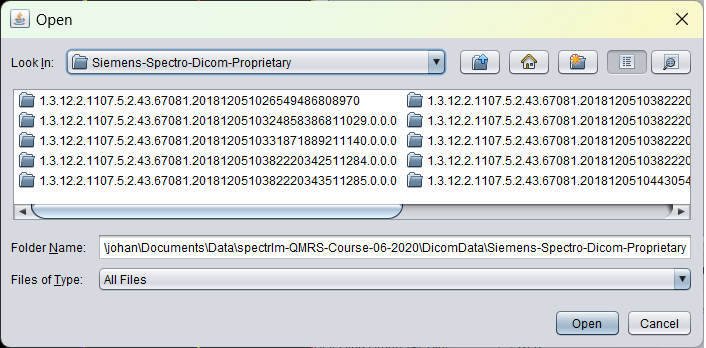
To be updated: replace this legacy browser screenshot with a version 3.0.1 Alpha screenshot using one of the downloadable example datasets.
Step 3: load image and spectroscopy data
After mounting, expand the patient/study tree and select the image or spectroscopy series. Loading the anatomical image provides the spatial reference. Loading the spectroscopy data places the MRS or MRSI voxel geometry on top of that image and populates the spectrum viewer.
The goal of the quick overview is not full quantification yet. It is to confirm that the dataset can be read, that the image and spectroscopy geometry are plausible, and that spectra are visible before moving on to preprocessing and TDFDFit.
Next step
Once the sample dataset is loaded, continue with the interactive processing workflow. That page describes voxel selection, preprocessing, HLSVD water removal or denoising, and creation of simple spectroscopic images.