Feature-based filtering
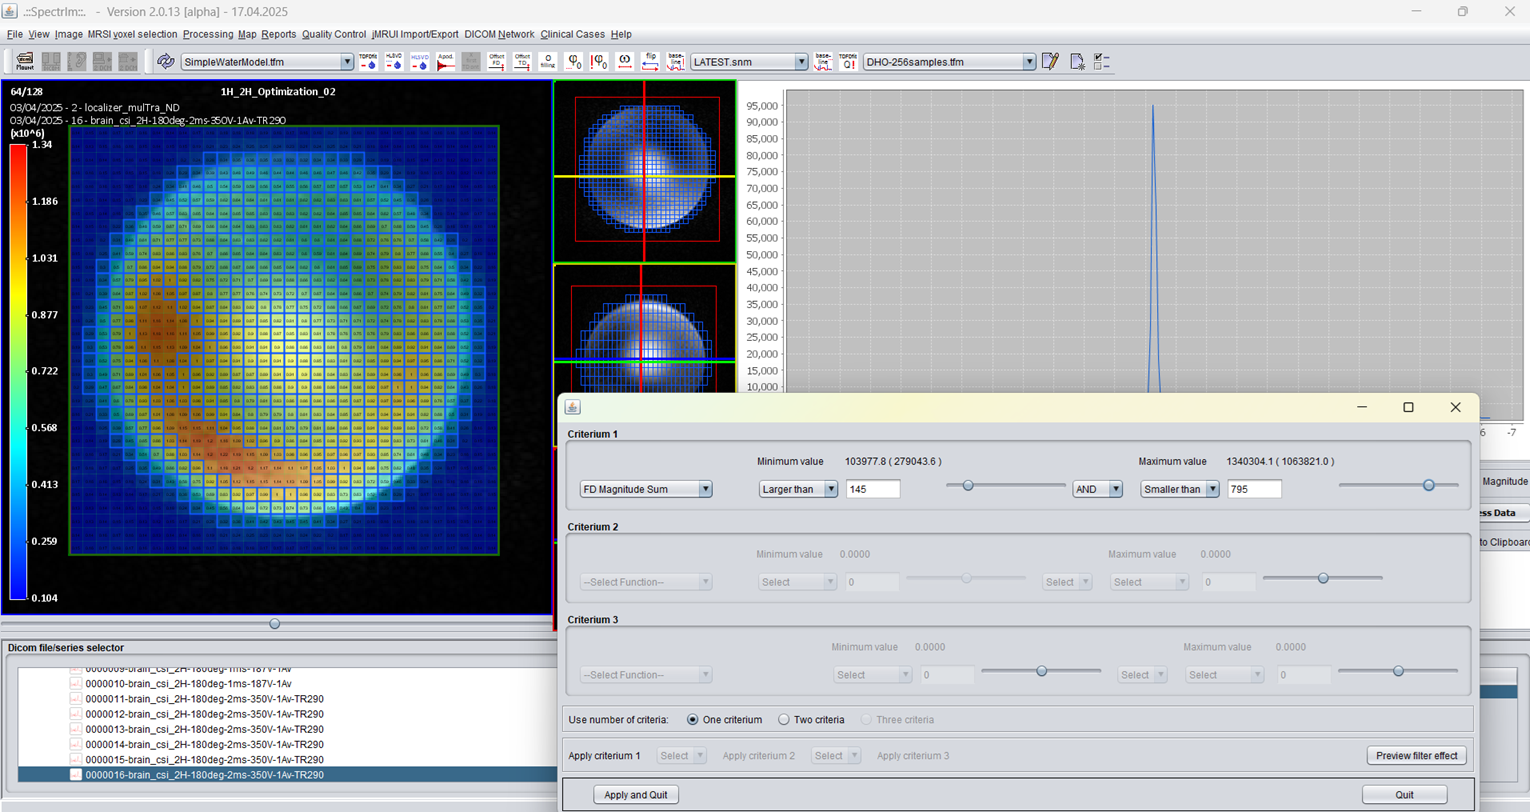
Legacy example of spectral-feature based filtering in a 3D MRSI dataset. The version 3.0.1 Alpha menu page documents the available selection commands.
 spectrIm-QMRS
Version 3.0.3 Alpha International
spectrIm-QMRS
Version 3.0.3 Alpha International
Current release: 3.0.3 alpha international for Windows and Linux. This guide retains earlier screenshots and version-specific descriptions. Their original version labels are preserved; appearance and window placement may differ in 3.0.3. See the release notes.
Workflow
This page ports the former video-only workflow page into a written version 3.0.1 Alpha guide. It describes how a user can move from a mounted DICOM dataset to inspected spectra, basic preprocessing, and simple spatial maps before continuing to full TDFDFit quantification.
The original website presented this workflow as a video tutorial. The video is preserved here so it can be reviewed against the current version 3.0.1 Alpha GUI and replaced or re-recorded where the workflow has changed.
Legacy tutorial video: processing MRS(I) data and creating simple spectroscopic maps. Review against version 3.0.1 Alpha before using as final user-facing training material.
The interactive workflow is intended for exploratory review of clinical or research MRS(I) data. It helps the user decide whether the dataset is correctly loaded, whether the spectroscopy grid is anatomically plausible, whether residual water or broad components need removal, and whether simple spectral features already show a spatial pattern worth investigating.
These quick maps are not a replacement for prior-knowledge fitting. For quantitative metabolite maps, the preferred version 3.0.1 Alpha route is to create or select a valid TDFDFit model and then use the parallel CPU fitting workflow.
In routine clinical use, start by mounting a patient or study directory via the File menu. spectrIm-QMRS scans the mounted directory, builds the patient/study tree, detects image and spectroscopy series, and lets the user load the relevant DICOM instances by selecting them in the Patient/Study Browser.
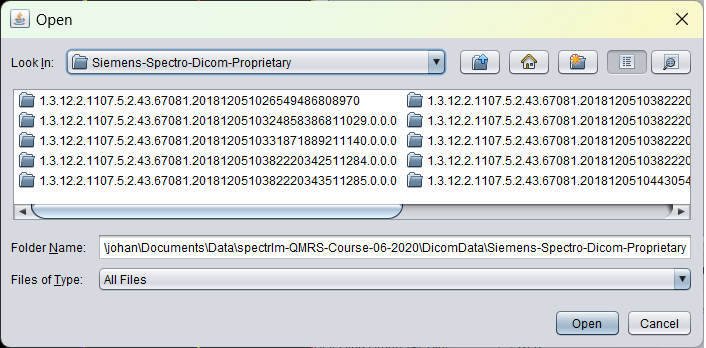
To be updated: replace this legacy browser screenshot with a current version 3.0.1 Alpha example once a suitable dataset is loaded for documentation screenshots.
After loading, verify that the MRS or MRSI voxel geometry is displayed correctly on the anatomical background image. Use the View menu to show or hide the MRSI grid, color bar, patient information, slice orientation, saturation bands, and fitted/original spectra. Use the Image menu for windowing, color scale, image statistics, and segmentation-related context.

For MRSI datasets, decide which voxels should be inspected or processed. The MRSI voxel selection menu supports all-voxel, excited-voxel, inner-voxel, freehand, mirrored, preset, tumor-region, and feature-based selections.
Feature-based selection is useful for large MRSI datasets because it can reduce the number of voxels that need manual review or fitting. The old website already emphasized this advantage for reducing tedious selection work in 3D MRSI.
Legacy example of spectral-feature based filtering in a 3D MRSI dataset. The version 3.0.1 Alpha menu page documents the available selection commands.
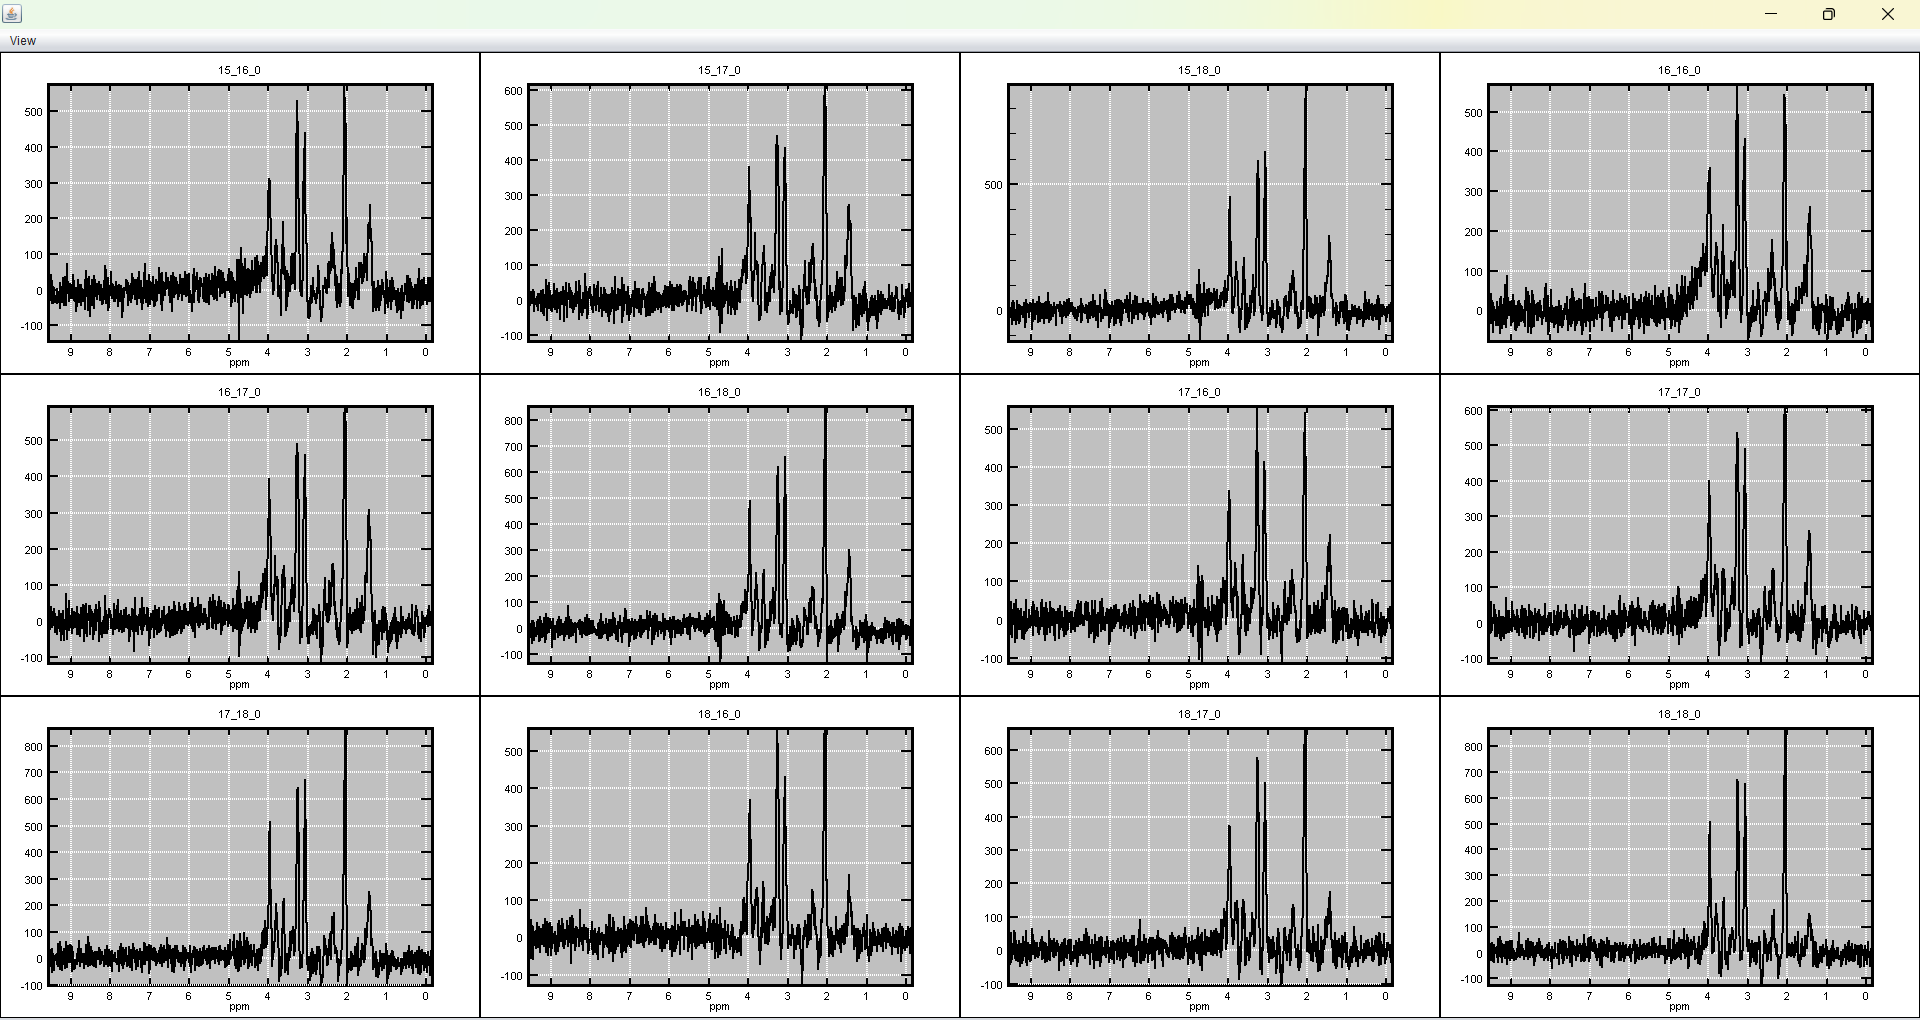
Legacy example of a 2D grid display of selected spectra. This view is useful for quickly detecting frequency shifts, residual water, poor SNR, lipid contamination, or spatially coherent metabolic changes.
The Processing menu contains the interactive preprocessing commands. A typical exploratory sequence is residual water removal or denoising, normalization, frequency-shift correction, phase correction, and optional apodization or zero filling. The correct order depends on the acquisition and on whether the goal is visual inspection, feature mapping, or final fitting.
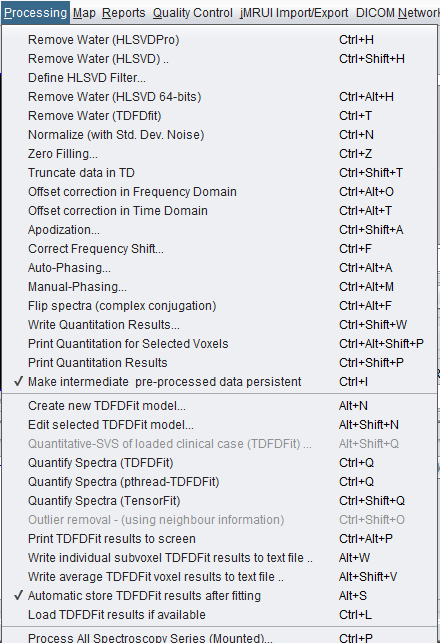
To be checked manually: once the final v3 preprocessing GUI behavior is frozen, add a short recommended order for common SVS, 2D-MRSI, and 3D-MRSI cases.
Version 3.0.1 Alpha includes improved HLSVD functionality for residual water removal, lipid removal, broad-component removal, removal of artefacts related to oversampled points, and denoising. These steps should be adjusted carefully because removing too many components can also remove real metabolite information.
For a deeper description of the compiled HLSVD algorithm and the Python interface layer used in spectrIm-QMRS, see the dedicated HLSVD page.
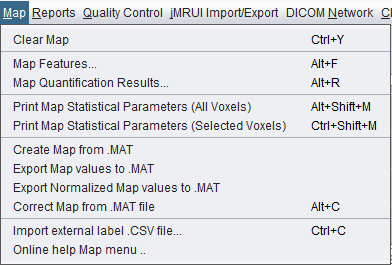
Simple spectroscopic images can be created from measured spectral features before full model-based quantification. The Map menu can create maps from built-in features such as signal intensity, SNR-like values, noise estimates, phase, statistical descriptors, quality values, and fitted values when fitting results are already available.
These feature maps are useful for rapid quality control and for exploratory visualisation. They should be interpreted as descriptive maps, not as final metabolite concentrations.
Once the dataset is loaded, inspected, selected, and preprocessed, the next step for quantitative work is TDFDFit. Clinical users should prefer automatically created or predefined models when available. Spectroscopy experts can refine or build models manually in the TDFDFit control frame.
For clinicians, spectrIm-QMRS can help create a valid model from the loaded dataset and basis-set simulation workflow.
Use predefined TDFDFit models with the version 3.0.1 Alpha parallel pthreads-TDFDFit fitting engine.
For spectroscopists, the TDFDFit modelling frame gives direct access to prior-knowledge model construction and optimization.