Color scale and range
The color-scale dropdown selects the lookup table used for the overlay. The scale-range fields show the active numeric display interval and can be edited manually when a fixed range is needed.
 spectrIm-QMRS
Version 3.0.3 Alpha International
spectrIm-QMRS
Version 3.0.3 Alpha International
Current release: 3.0.3 alpha international for Windows and Linux. This guide retains earlier screenshots and version-specific descriptions. Their original version labels are preserved; appearance and window placement may differ in 3.0.3. See the release notes.
Clinical Viewer GUI
The Map Quantification Results window creates metabolite and fitted-parameter maps from available quantification results. It is typically used after TDFDFit quantification, when fitted amplitudes, areas, frequency shifts, damping parameters, or ratios need to be inspected as spatial overlays on the anatomical image and MRSI grid.
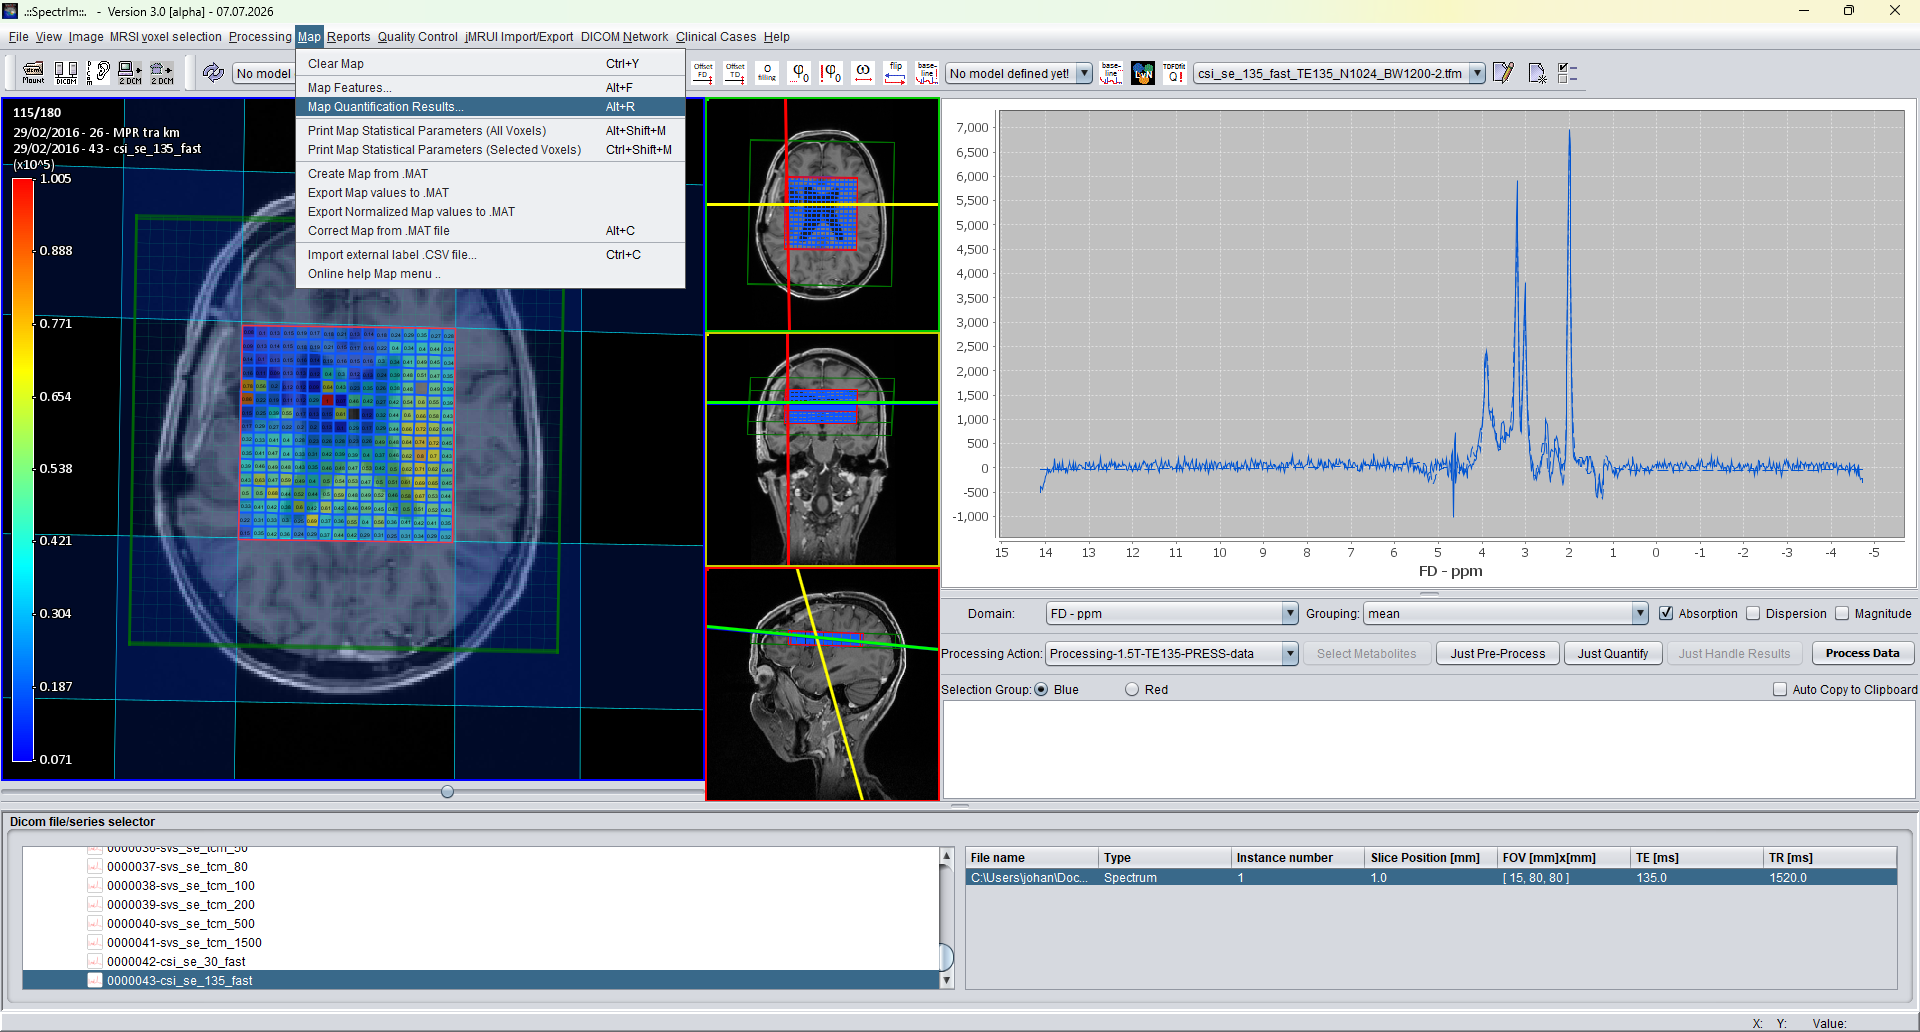
In the Clinical Viewer, open the Map menu and choose Map Quantification Results. The dialog uses the metabolites and fitted result fields that are available in the loaded quantification result store.
The same fitted results can later be used by reporting tools, but this window is the direct interactive route for checking whether a fitted quantity gives a plausible spatial map.
The standard tab maps one fitted parameter for one metabolite or component. The version 3.0.1 Alpha dialog contains interactive auto-scale clipping controls, transparent clipped-outlier display by default, and an Interpolate display option for cosmetic in-plane interpolation. The Apply Gaussian filter button remains available for spatial smoothing of the displayed scalar map.
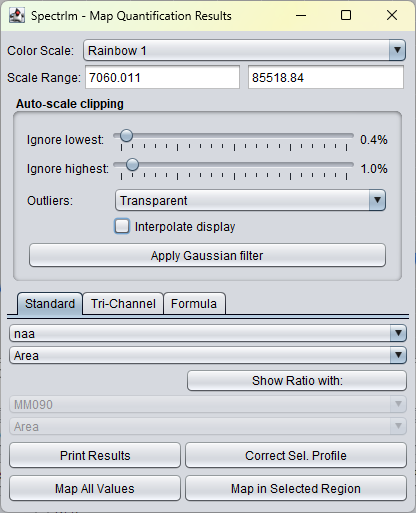
The color-scale dropdown selects the lookup table used for the overlay. The scale-range fields show the active numeric display interval and can be edited manually when a fixed range is needed.
The lowest and highest percentage sliders exclude extreme scalar map values from automatic range estimation in real time. With the default transparent outlier mode, clipped voxels are not colored in the overlay.
The interpolation checkbox changes only how a scalar map is drawn on screen. It does not alter fitted values, statistics, exports, or reports.
The Gaussian filter button applies spatial smoothing to the currently displayed scalar map. The display range is recalculated afterwards, using the active clipping and outlier settings.
The lower buttons map either all available values or only the selected region. The Print Results and Correct Selection Profile buttons provide quick access to fitted-result review and selection-profile correction.
The first dropdown selects the fitted metabolite, model component, or resonance group. The names are taken from the loaded fitting model and result definitions.
The second dropdown selects the fitted quantity to display. Typical choices include area, amplitude, frequency shift, damping, phase, or quality-related parameters, depending on the fitting results.
Creates a color overlay using all available map values. This is useful for a global overview of the fitted quantity over the MRSI grid.
Creates the map only for the currently selected voxels. This is useful when the user wants to inspect a lesion region, a reference region, or another selected part of the spectroscopy grid.
A single extreme voxel can make the automatic color range unusable for the remaining map. The auto-scale clipping controls solve this as a display operation: the underlying fitted values are preserved, but the automatic color scale can ignore a chosen percentage of the lowest and highest scalar map values.
Excludes the selected percentage of the lowest map values from
automatic min/max estimation. The default is 0.0%,
which keeps the traditional full-range behavior.
Excludes the selected percentage of the highest map values from automatic min/max estimation. This is the common setting when one hot outlier voxel compresses the useful color variation elsewhere.
Moving either percentage slider updates the current scalar map immediately. The scale range fields and displayed overlay follow the slider values while the user tunes the setting.
Excluded outliers can either keep saturated end colors or become transparent. Transparent display is the default because it makes clipped voxels visibly absent from the overlay. Saturated colors remain available when the user wants outliers to stay visible at the scale endpoints.
MRSI maps often have much lower spatial resolution than the anatomical images beneath them. The Interpolate display option provides a smoother visual overlay while keeping the original voxel-wise quantification unchanged. This is mainly a cosmetic display option; the non-interpolated voxel display remains the most direct representation of the measured grid.
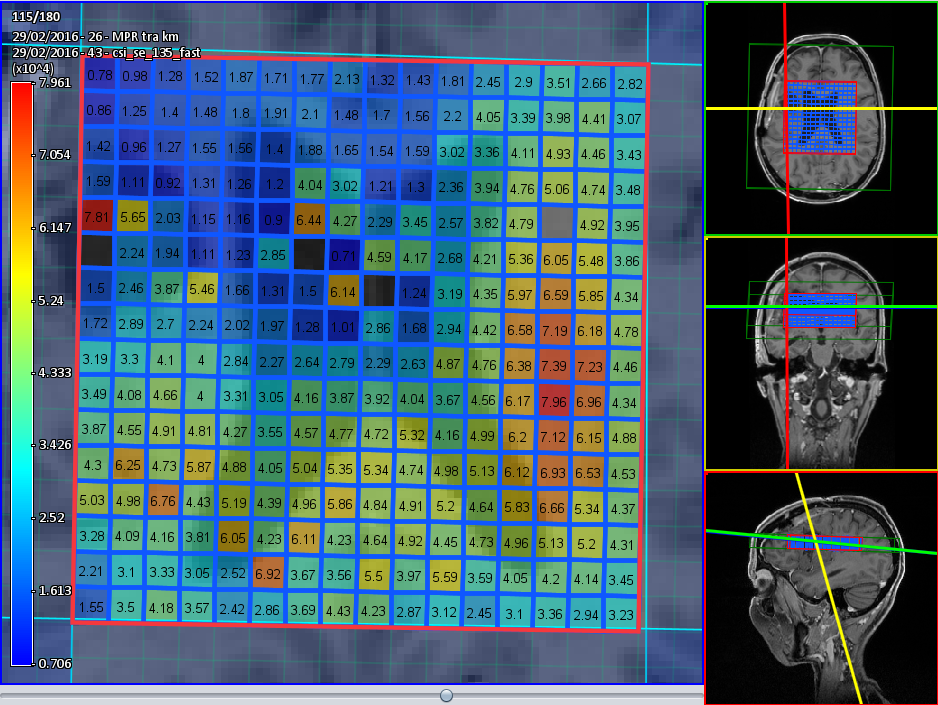
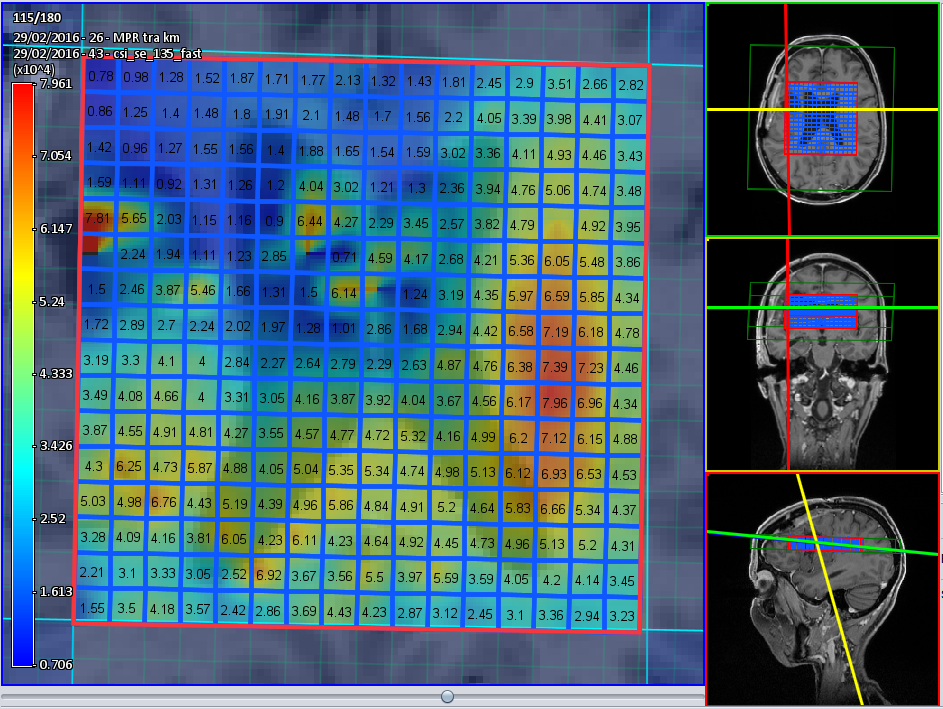
spectrIm-QMRS uses bilinear interpolation in the displayed 2D MRSI grid plane. For each screen pixel inside the projected MRSI voxel area, the position is mapped back into fractional grid coordinates and the displayed scalar value is calculated from the four neighboring voxel values using linear weights.
Interpolation does not create new measured data and can behave less optimally near missing, transparent, or very strong outlier voxels. When outlier clipping is active, transparent outlier voxels are excluded from the displayed interpolation weights.
The Map Quantification Results window includes an Apply Gaussian filter button for the currently displayed scalar map. This uses the same spatial smoothing operation that is available in the Map Features GUI.
After smoothing, the map range is recalculated and the current auto-scale clipping and outlier display settings remain active. The operation changes the displayed map values, so it should be used as a visualization aid and interpreted together with the original fitted values.
The standard tab can also create a simple ratio by enabling the ratio control and selecting a second metabolite/component and parameter. The Formula tab supports more complex numerator and denominator combinations.
Ratio and formula maps use the same scalar color-map display path as standard maps, so the auto-scale clipping controls are useful there as well. Tri-channel maps use separate RGB channel scaling and do not use the scalar clipping controls.
The Map menu page describes the surrounding commands for creating, clearing, exporting, and statistically summarizing maps.
The fitting workflow page explains how predefined TDFDFit models are applied before quantification maps are generated.