Current page Two-Compartment SVS Absolute Quantification

Current release: 3.0.3 alpha international for Windows and Linux. This guide retains earlier screenshots and version-specific descriptions. Their original version labels are preserved; appearance and window placement may differ in 3.0.3. See the release notes.

Clinical SVS workflow in version 3.0.1 Alpha

Two-compartment water reference quantification

The quantitative clinical SVS workflow connects silent TDFDFit fitting, same-study water-reference loading, and a two-compartment water decay model. The aim is to turn fitted metabolite areas into compartment-corrected concentration estimates that can be reviewed directly in the Clinical Viewer.

What the workflow does

When the user starts Quantitative-SVS of loaded clinical case (TDFDFit), spectrIm-QMRS fits the currently displayed SVS spectrum with the selected TDFDFit model. The expert modelling frame is no longer opened for this clinical route; the fit is run as an internal processing step and the result is shown in the clinical quantification window.

The workflow then resolves the matching water reference data from the same DICOM study. A water-suppressed spectrum such as svs_se_30_ws or svs_se_135_ws is paired with the corresponding non-water-suppressed reference svs_se_30_nws or svs_se_135_nws. The additional svs_se_tcm_* series provide the echo-time samples for the two-compartment water decay fit.

Clinical review window

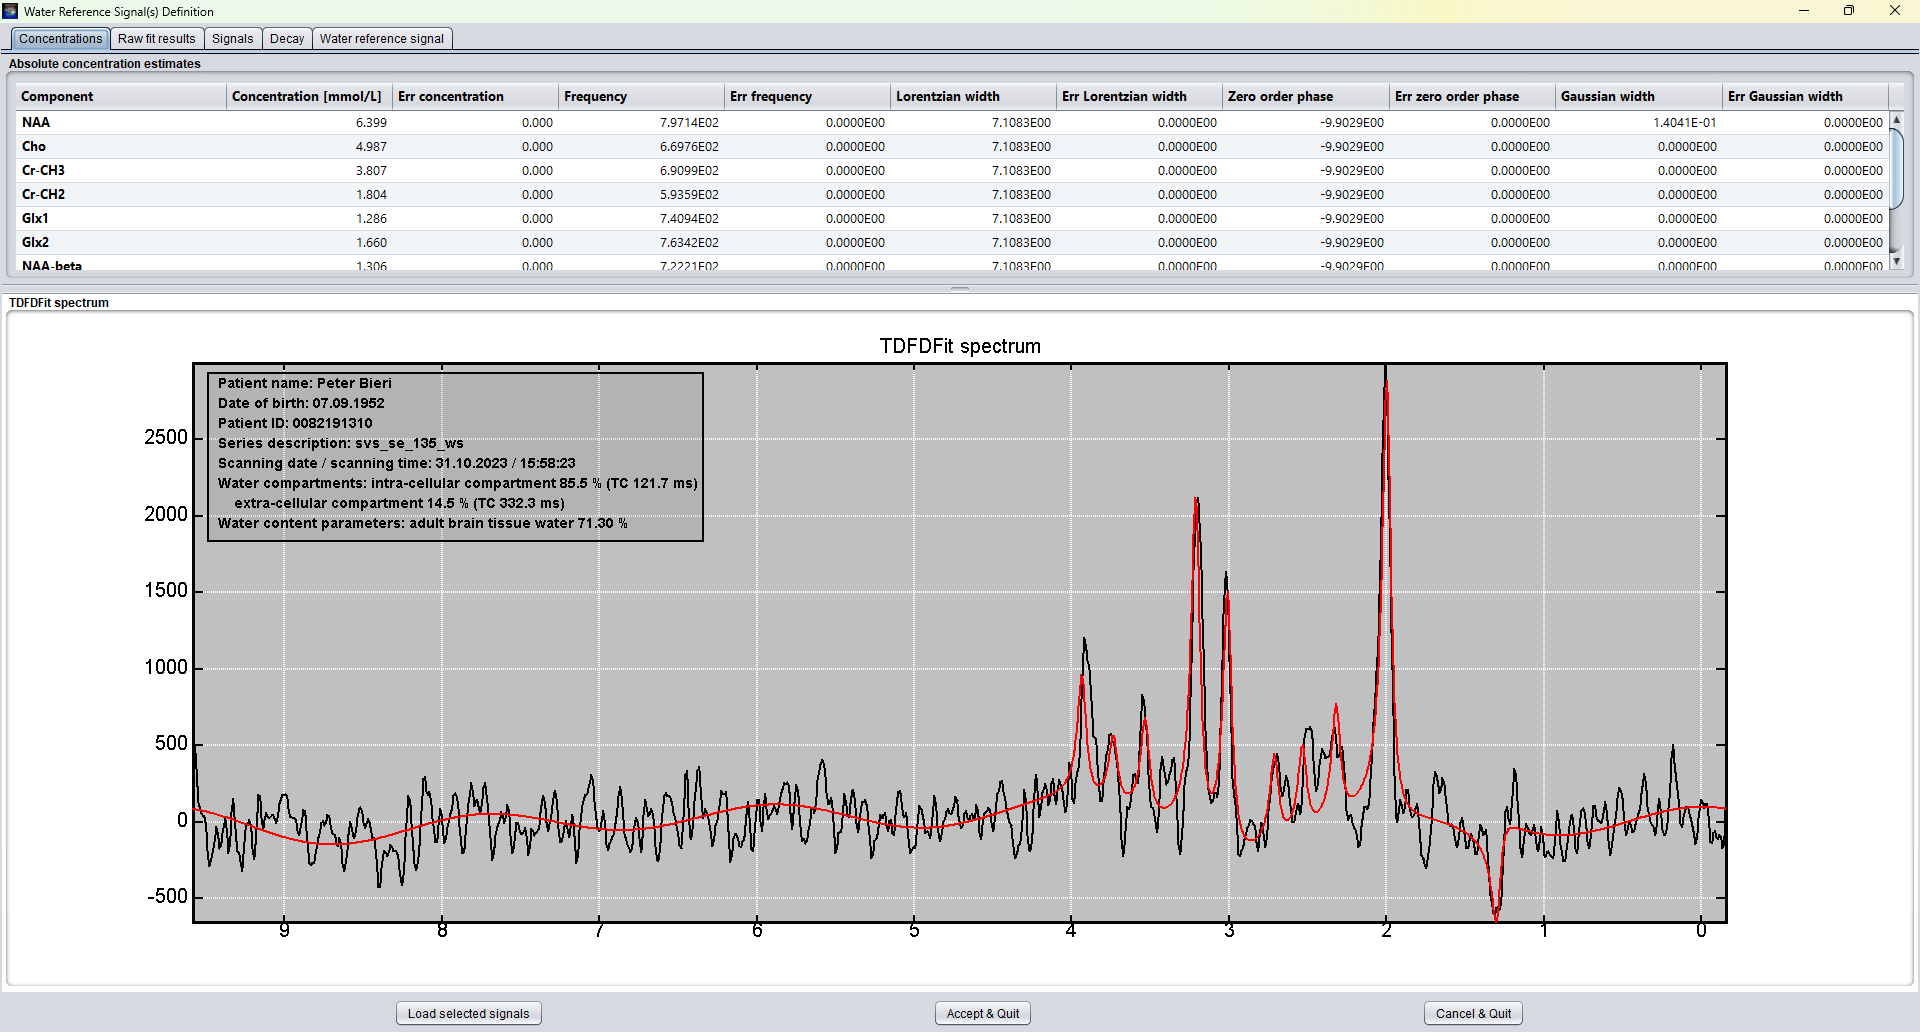
The first clinical implementation displays the compartment-corrected concentration table above the fitted SVS spectrum. The spectrum panel overlays the measured signal and the TDFDFit model result, together with patient and study information and the fitted water compartment interpretation.

Clinical SVS quantification window showing concentration estimates and TDFDFit spectrum overlay
Prototype clinical SVS absolute quantification window in spectrIm-QMRS 3.0.1 Alpha. The upper table reports metabolite concentration estimates and fit parameters; the lower panel shows the measured spectrum, the fitted model, and the fitted intra-cellular and extra-cellular water compartments.

Protocol pattern

1. Water-suppressed SVS

The clinically interpreted spectrum is loaded from a series such as svs-se-30-ws or svs-se-135-ws. This spectrum is silently fitted with the selected TDFDFit model.

2. Same-TE water reference

The matching non-water-suppressed series svs-se-30-nws or svs-se-135-nws provides the water signal used as the internal concentration reference.

3. Two-compartment water decay

The svs-se-tcm_30, svs-se-tcm_40, svs-se-tcm_50, svs-se-tcm_80, svs-se-tcm_100, svs-se-tcm_200, svs-se-tcm_500, and svs-se-tcm_1500 style series sample the water decay across echo times.

4. Clinical result view

The clinical window presents concentrations, raw TDFDFit results, loaded signals, decay fit, and the water-reference signal without forcing the clinician through the expert model editor.

Two-compartment water model

The water-reference decay is modeled as a bi-exponential signal:

\[ S(TE) = M \left(A_1 e^{-TE / TC_1} + A_2 e^{-TE / TC_2}\right) \]

The fitted component with the shorter time constant is reported as the intra-cellular compartment. The component with the longer time constant is reported as the extra-cellular compartment. The relative compartment sizes are then used together with the configured tissue-water content to correct the water reference used for absolute quantification.

From fitted areas to concentrations

The concentration table starts from the raw metabolite areas produced by TDFDFit. Baseline components are excluded from the clinical concentration table. For each metabolite component, the raw area is scaled by the fitted water-reference amplitude, the configured tissue-water fraction, and the component multiplicity where appropriate.

The result is reported in mmol/L so that values are in the familiar clinical spectroscopy range rather than raw arbitrary fitting units. The same table also exposes the fitted frequency, Lorentzian width, zero-order phase, Gaussian width, and the corresponding Cramer-Rao style errors from the TDFDFit result output.

Why this matters

Routine clinical SVS quantification needs more than a raw fitted amplitude. The visible metabolite spectrum, the water reference, and the compartment composition all influence the concentration estimate. Automating these associations makes the workflow closer to radiology routine: load the examination, select the clinical quantification action, inspect the fitted spectrum, and review the concentration table.

This is also a design step away from exposing every research GUI decision to the clinician. The expert TDFDFit tooling remains available for model construction and validation, while the Clinical Viewer can provide the focused result view needed for repeated clinical use.
Alpha-stage validation note

This page describes the current development workflow in spectrIm-QMRS 3.0.1 Alpha. The values depend on correct protocol matching, spectral preprocessing, water-reference quality, model validity, and site-specific validation. The workflow is intended as the basis for state-of-the-art compartment-corrected absolute quantification, not as a replacement for clinical validation and expert review.