View menu
Controls visibility of original spectra, fitted spectra, difference spectra, grid overlays, patient labels, and other viewer elements.
 spectrIm-QMRS
Version 3.0.3 Alpha International
spectrIm-QMRS
Version 3.0.3 Alpha International
Current release: 3.0.3 alpha international for Windows and Linux. This guide retains earlier screenshots and version-specific descriptions. Their original version labels are preserved; appearance and window placement may differ in 3.0.3. See the release notes.
Clinical Viewer GUI
The main spectrum viewer is where selected MRS or MRSI signals are inspected, compared, preprocessed, and reviewed after fitting. This page ports the old functional overview of spectrum display modes into the version 3 website and connects it to the current View, MRSI voxel selection, and processing pages.
spectrIm-QMRS can display spectra from a single selected voxel, a selected group of voxels, or an MRSI region. The old website showed several display modes for selected spectroscopic voxels, including display of all individual spectra from the user-selected voxel group. These modes are useful for checking heterogeneity, outliers, residual water, lipid contamination, and the effect of preprocessing before quantitative fitting.
The exact mode is selected from the spectrum-view controls and the View menu options for original spectra, fitted spectra, and difference spectra. In routine work, users often start with a mean or grouped display and then inspect individual spectra when the group behaviour looks suspicious.
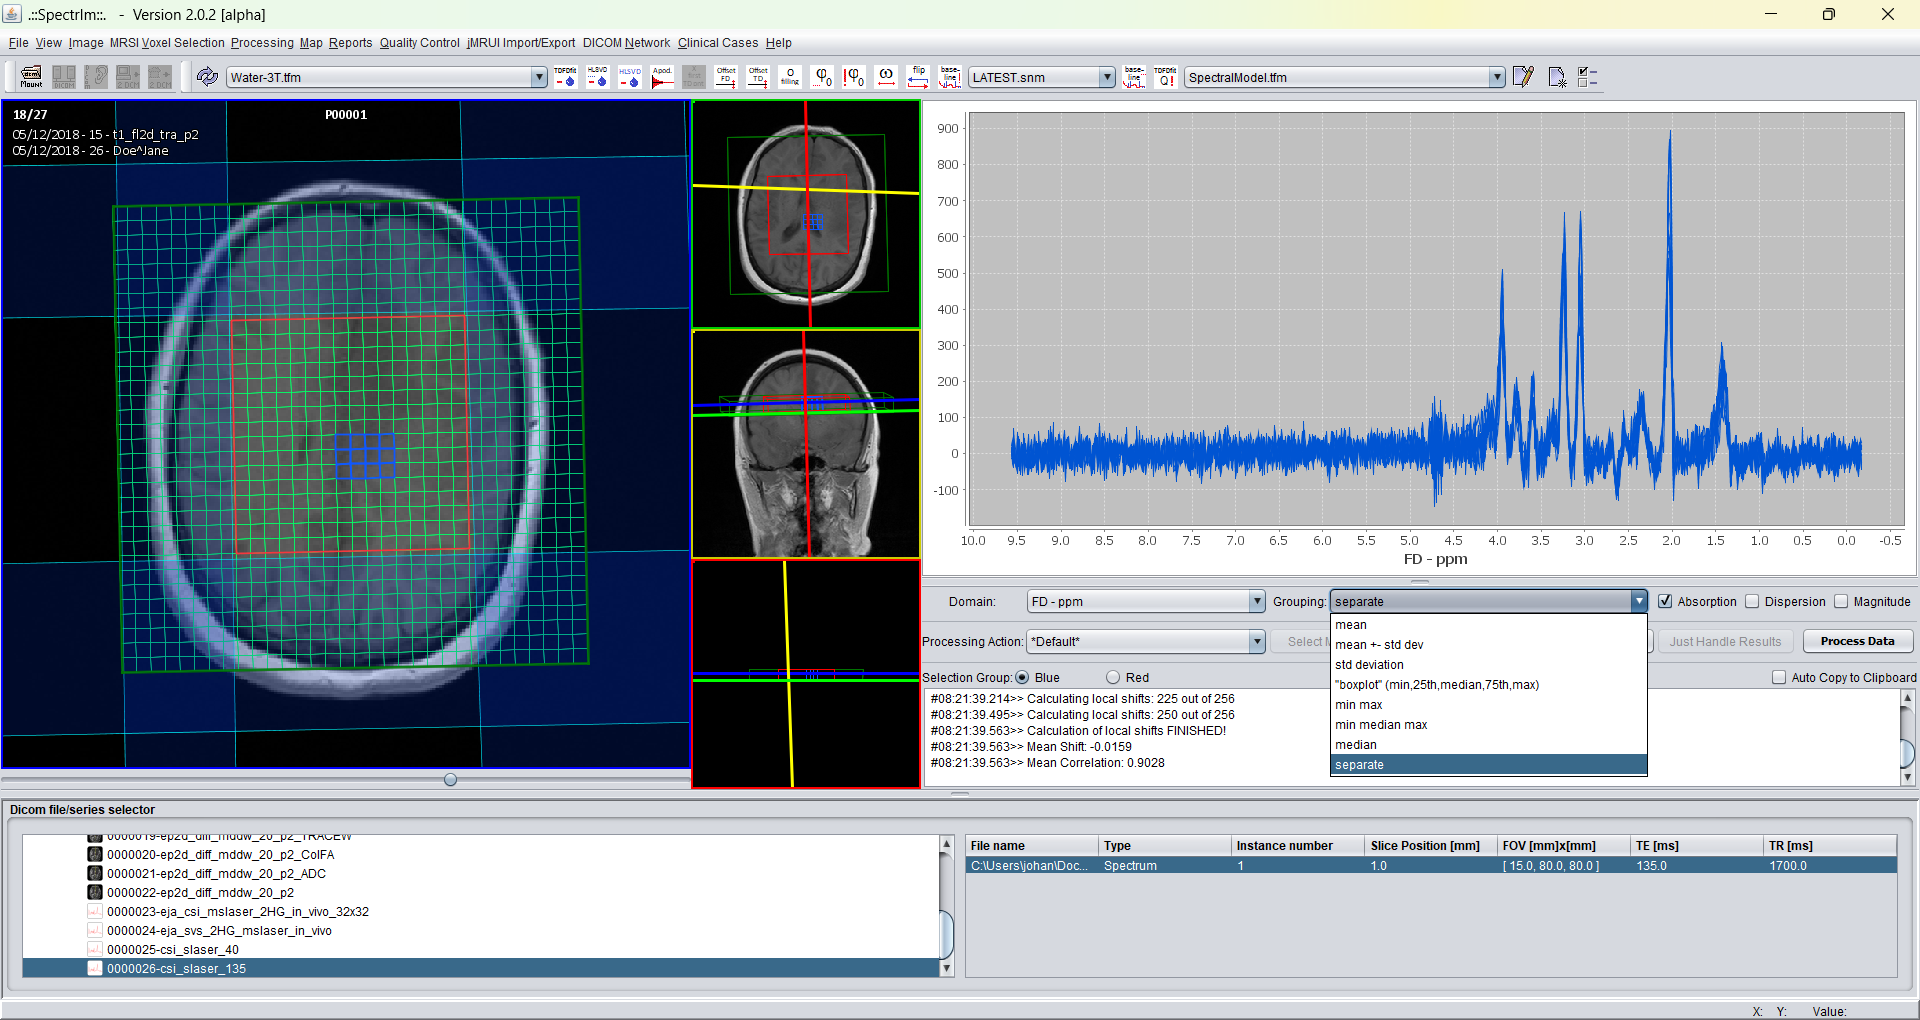
The screenshot below is preserved from the old website and shows the concept of switching the main spectrum display mode for selected MRSI voxels. It should later be replaced with a version 3.0.1 Alpha screenshot when a clean example dataset is loaded.
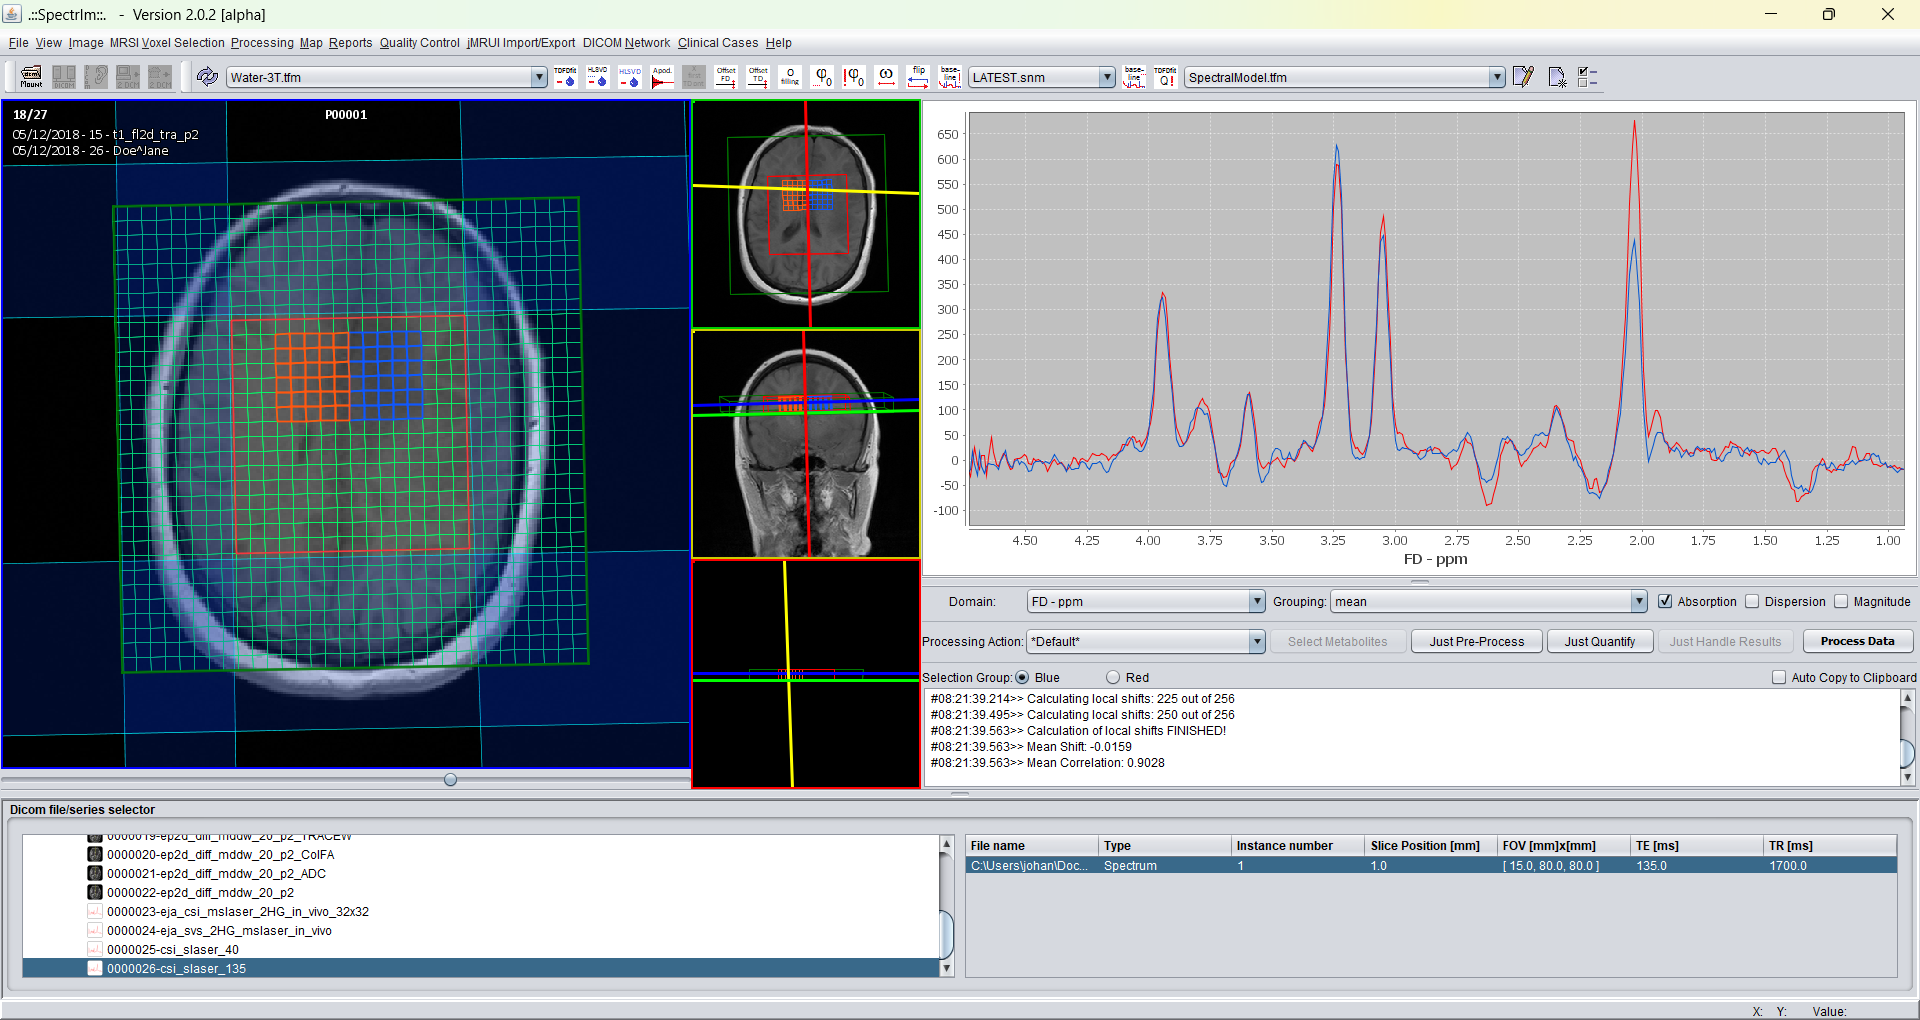
The Clinical Viewer supports two selection groups, commonly shown as blue and red. This makes it possible to compare spectra from two different anatomical or pathological regions in the same examination. For example, one group may represent a suspicious region and the other a contralateral or reference region.
When both groups are defined, spectra can be displayed simultaneously. The View menu also includes a difference-spectrum option, which helps reveal spectral changes between the two selected groups. This is useful for qualitative review and for deciding whether a later TDFDFit model should be applied to selected voxels, all excited voxels, or a smaller region of interest.
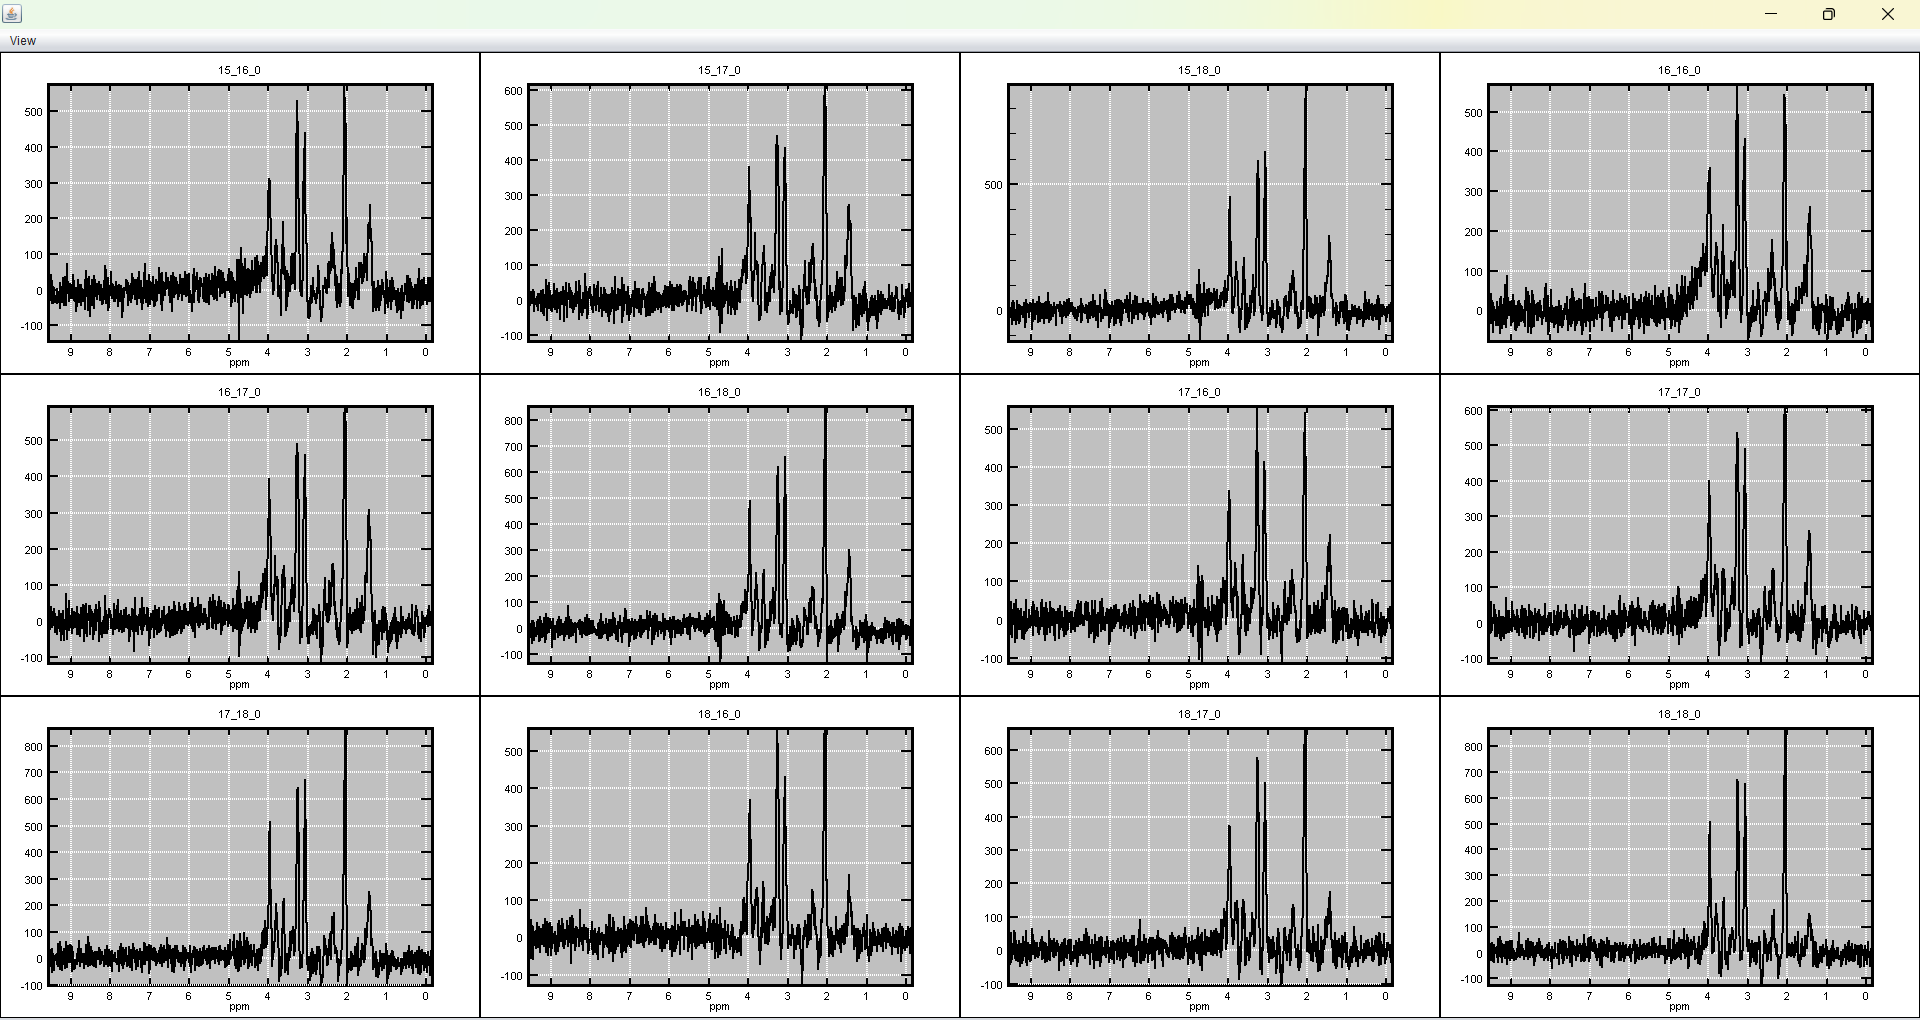
For MRSI datasets, selected spectra can also be displayed as a 2D grid. The grid view preserves spatial relationships between spectra and is therefore useful when evaluating whether signal changes are focal, regional, or caused by a broader acquisition or preprocessing issue.
The old example below shows a 4 x 4 selected subgrid. In the v3 documentation, this view connects naturally to the MRSI voxel selection menu and to workflows where selected spectra are later fitted or mapped.
Controls visibility of original spectra, fitted spectra, difference spectra, grid overlays, patient labels, and other viewer elements.
Defines all, excited, inner, feature-filtered, freehand, mirrored, preset, and tumor-region voxel groups.
Shows how selected spectra move from inspection to preprocessing, HLSVD handling, simple maps, and TDFDFit.