Current page Introduction to in vivo MRS(I)

Clinical background

Introduction to In Vivo MR Spectroscopy and Spectroscopic Imaging

Magnetic resonance spectroscopy, MRS, extends MRI from anatomy toward chemistry. Instead of only asking where tissue structures are, it asks which molecular signals are present in a selected volume or across a spectroscopic imaging grid.

Why clinicians use MRS(I)

Conventional MRI is excellent for showing morphology, contrast enhancement, edema, necrosis, blood products, and treatment-related changes. MRS adds complementary metabolic information. A spectrum can show signals from compounds such as N-acetylaspartate, choline compounds, creatine, lactate, lipids, myo-inositol, glutamate, glutamine, 2-hydroxyglutarate, GABA, or other metabolites, depending on field strength, sequence, echo time, editing scheme, and tissue type.

This information is not a replacement for radiological assessment, pathology, molecular diagnostics, or clinical judgement. It is an additional measurement that may help characterize tissue biology, guide research questions, compare regions, or support clinical interpretation when the acquisition and processing are reliable.
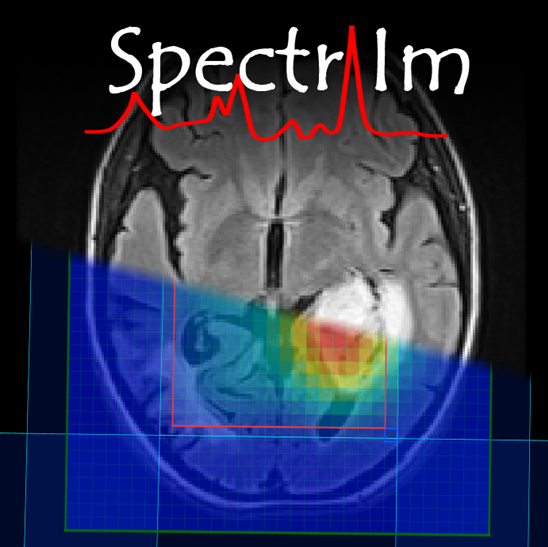
MRS versus MRSI

Single-voxel spectroscopy

Single-voxel MRS measures one localized volume. It is often easier to prescribe, faster to inspect, and simpler to interpret than a full spectroscopic image. The price is that a single voxel samples only one region, so placement is critical.

MR spectroscopic imaging

MRSI measures many spatially distributed spectra. This can show metabolic heterogeneity across a lesion, perilesional tissue, contralateral tissue, or a larger anatomical field of view. The price is a larger quality-control and processing burden.

Edited spectroscopy

Spectral editing techniques such as MEGA-editing or SLOW-editing try to reveal signals that overlap with stronger resonances in conventional spectra. Edited data can be powerful but require careful acquisition design and matched processing.

Multinuclear and X-nuclei spectroscopy

Proton MRS is the most common clinical route, but spectroscopy can also target other nuclei. The acquisition, sensitivity, frequency referencing, and expected metabolites differ, so the processing workflow must be adapted to the nucleus and scanner data format.

What a spectrum means

A spectrum is a frequency-domain representation of the time-domain MR signal. Peaks appear at characteristic chemical shifts, commonly displayed in ppm. Their position, phase, linewidth, shape, and area are influenced by the molecule, local magnetic field, sequence, tissue environment, preprocessing, and fitting model.

Peak position

Chemical shift helps identify resonances, but peaks can move because of imperfect frequency referencing, B0 variation, local susceptibility, or processing choices.

Peak shape

Narrow peaks usually indicate better field homogeneity and spectral resolution. Broad peaks can reflect poor shimming, short T2 components, macromolecules, lipids, or baseline contributions.

Peak area

Quantification tries to estimate the contribution of each metabolite component. Area is not simply peak height; it depends on lineshape, overlap, baseline, relaxation, and the fitted model.

Noise and artifacts

Residual water, extracranial lipid, motion, insufficient shimming, frequency drift, phase errors, and low SNR can all produce spectra that look plausible but are unreliable for quantification.

What processing does

Processing prepares the measured signal for inspection and quantification. It may include frequency alignment, water or lipid removal, denoising, offset correction, apodization, phase correction, voxel selection, quality filtering, and conversion to metabolite maps.

Each processing step changes the data. Some steps are mainly for visualization, while others are necessary before fitting. For clinical users, the safest workflow is to keep processing choices protocol-based, inspect intermediate results, and avoid changing parameters until their effect is understood.

From data to clinically meaningful output

1

Acquire carefully

Good voxel placement, shimming, water suppression, anatomical coverage, and sequence choice are the foundation. Processing cannot fully rescue a poor acquisition.

2

Inspect anatomy and grid

Check that the spectroscopy volume or MRSI grid covers the intended tissue and avoids unwanted contamination when possible.

3

Preprocess consistently

Apply water/lipid removal, alignment, phasing, and other steps according to the protocol, then inspect whether they improved the spectra without creating artifacts.

4

Fit with a valid model

Use a TDFDFit model or generated basis set that matches the acquisition. A model created for a different sequence or echo time can give misleading results.

5

Review quality

Inspect spectra, residuals, quality labels, and spatial maps. Exclude poor voxels before drawing biological or clinical conclusions.

6

Interpret with context

Metabolite maps should be interpreted together with MRI, clinical history, pathology, treatment status, and known limitations of the acquisition.

Typical clinical questions

Is the region metabolically abnormal?

MRS(I) can compare lesion, perilesional, and contralateral regions. The answer depends on reliable spectra, appropriate normalization or quantification, and careful anatomical registration.

Is the abnormality heterogeneous?

MRSI can reveal spatial variation that a single voxel may miss. This can be useful for research, biopsy planning discussions, or studying lesion margins, but quality varies across the grid.

Can a specific metabolite be detected?

Some metabolites are visible in conventional spectra; others require editing, high field strength, long acquisition, or model-based fitting. Non-detection does not always mean absence.

Can results be compared over time?

Longitudinal comparison requires consistent acquisition, placement, preprocessing, fitting, and quality control. Changes in protocol can look like biological changes.

Where to continue

New users should next learn how the Clinical Viewer is organized, how to load example DICOM data, and how to inspect spectrum display modes before starting quantitative fitting.