File menu
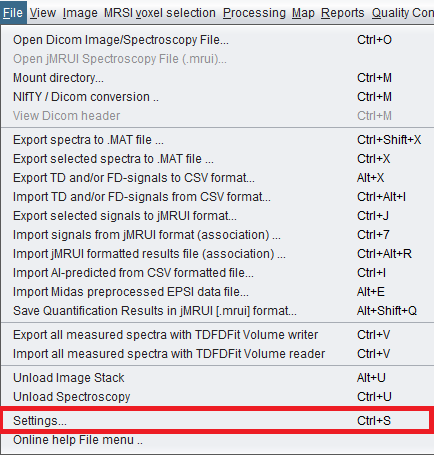
The Settings item is located near the bottom of the File menu, after the unload commands and before online File menu help.
 spectrIm-QMRS
Version 3.0.1 Alpha
spectrIm-QMRS
Version 3.0.1 Alpha
Clinical Viewer GUI
The Settings window is opened from File > Settings.... It contains processing pipelines, report settings, and other global options. This page focuses on the default preprocessing action used before quantification or map creation.
Open the File menu in the Clinical Viewer and choose
Settings.... The shortcut is Ctrl+S.
A spectroscopy dataset must be loaded first, because some
preprocessing defaults depend on the spectral axis of the current
dataset.
The most important setting for routine preprocessing is the Default-preprocessing action in the Processing Pipelines tab. This action is designed to be immediately usable for common MRS(I) datasets without manually choosing a flat frequency range.
The Settings item is located near the bottom of the File menu, after the unload commands and before online File menu help.
In the Processing Pipelines tab, select Default-preprocessing under Pre-processing Actions. The lower table can attach this preprocessing action to a named processing pipeline together with optional series filters, quantification actions, and results actions.
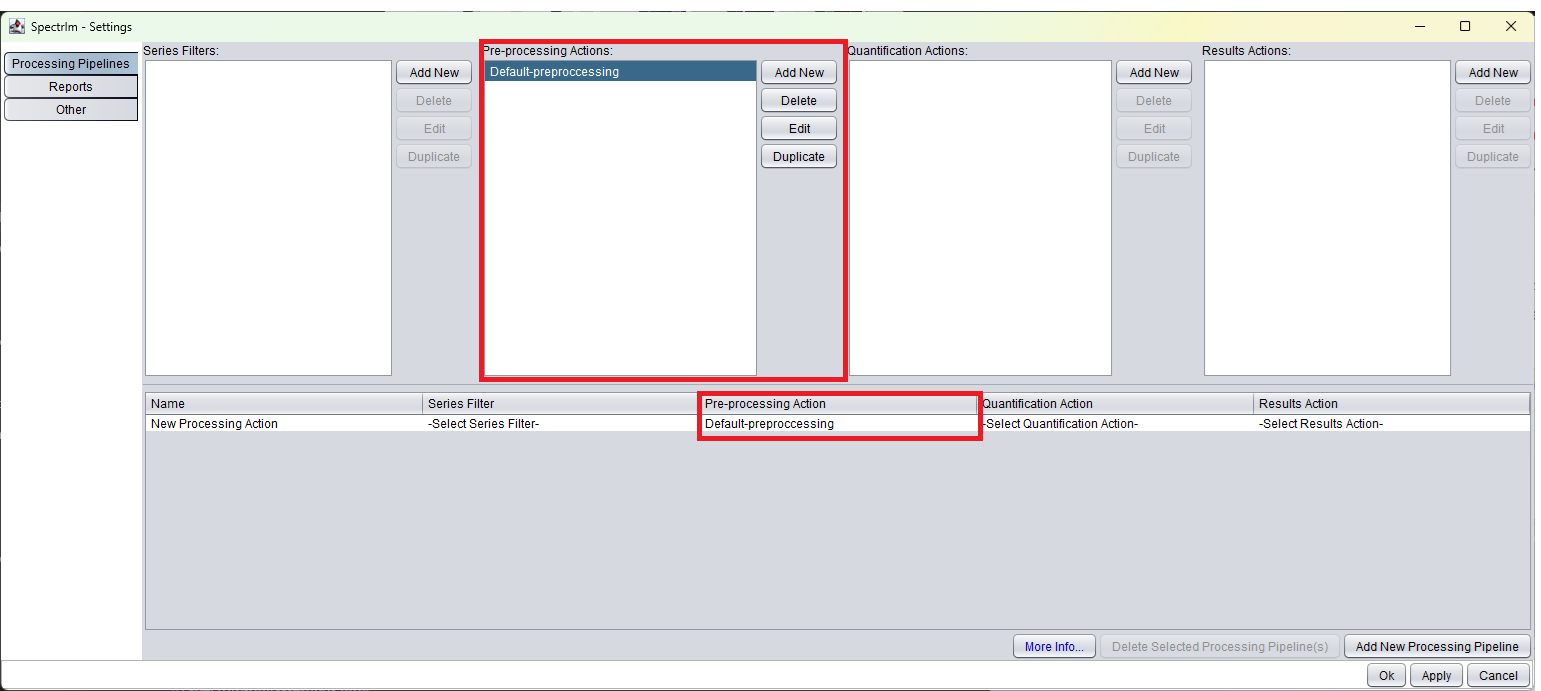
A processing pipeline can combine a series filter, a preprocessing action, a quantification action, and a results action. The current page documents the default preprocessing action first. The other component types are marked here as placeholders and will be extended in future documentation.
Series filters are intended to select which loaded or mounted spectroscopy series a processing pipeline should apply to. In automatic batch processing, spectrIm-QMRS iteratively opens a selected directory and its subdirectories. If an MRS(I) series matches the selected filter criteria, the complete pipeline is run for that series.
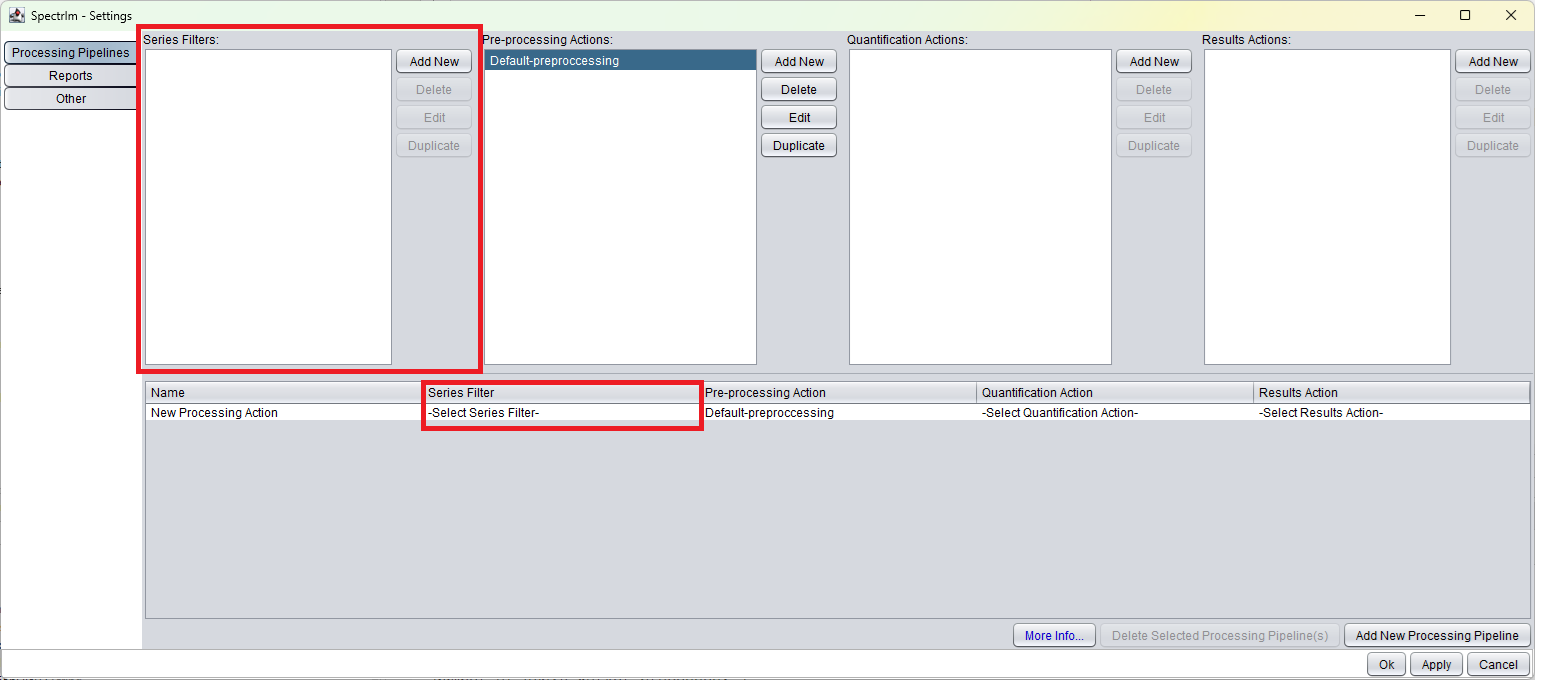
Pre-processing actions define the ordered spectral operations applied before quantification. The default action currently contains HLSVDPro water removal, frequency alignment, and adaptive frequency-domain offset removal.
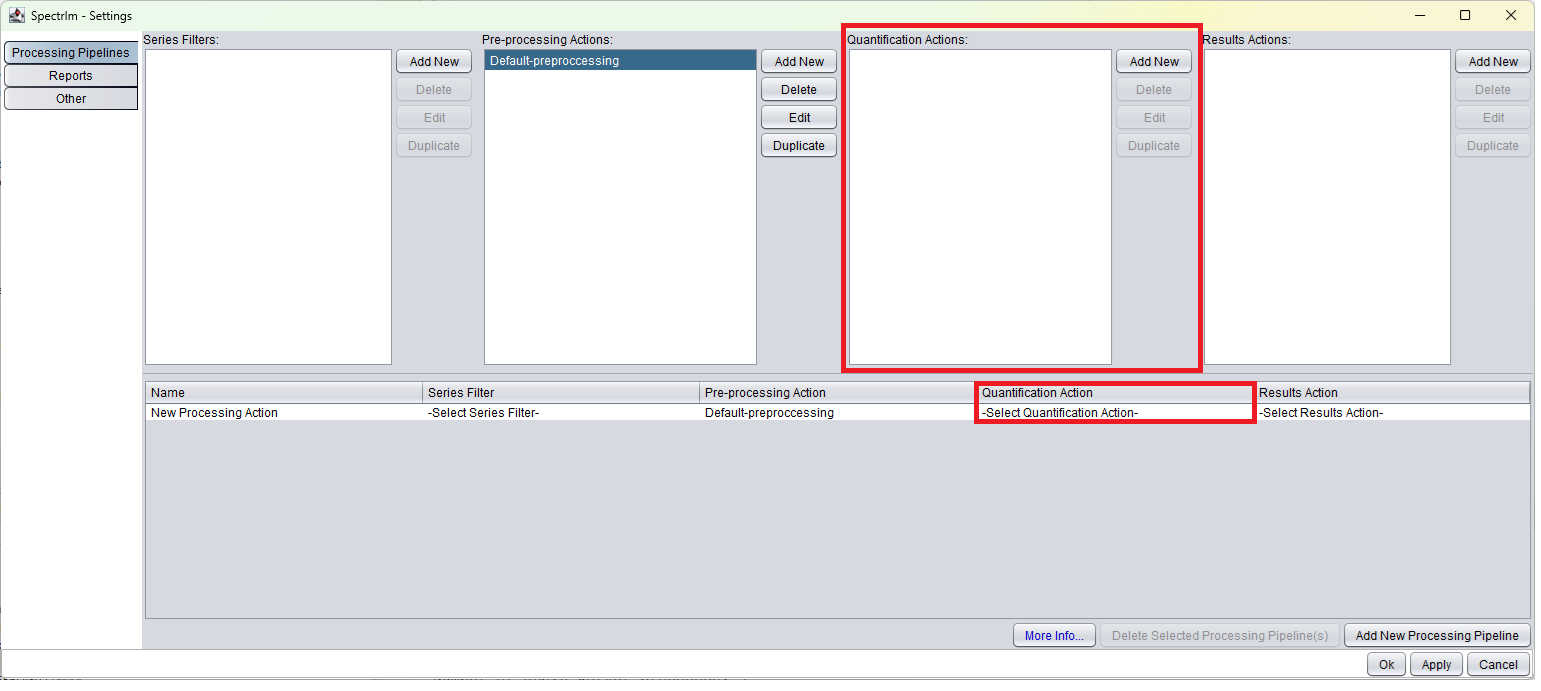
Quantification actions define how spectra are quantified after preprocessing. A new action can use the default TDFDFit model for the loaded data, or the user can select another TDFDFit model explicitly.
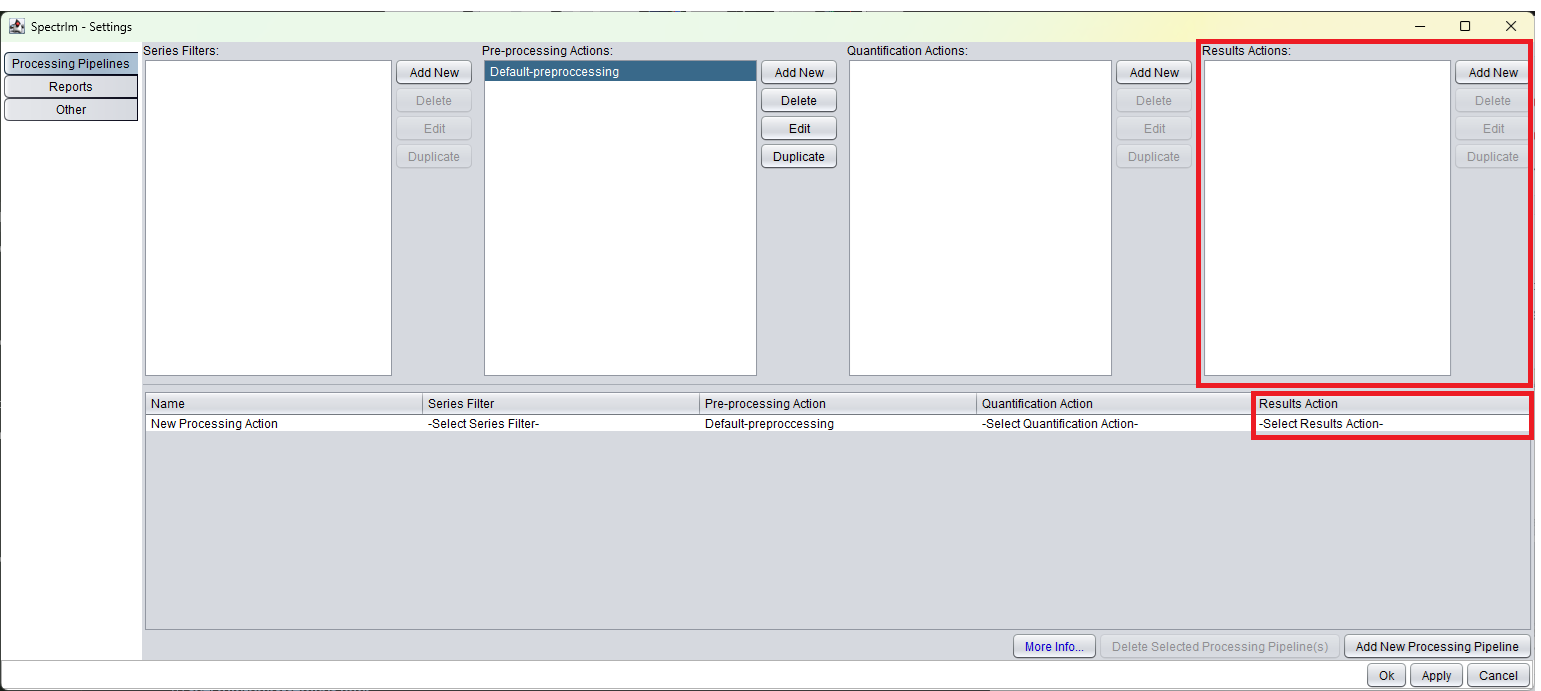
Results actions will define what happens after quantification, such as saving results or generating derived output. This placeholder will later describe available result handlers and how they are attached to a processing pipeline.
Press Add New in the Series Filters column to open the Series Filter Editor. When a spectroscopy dataset is loaded, the editor is pre-filled with the current series description, TE, TR, field strength, nucleus, bandwidth, manufacturer, and scanner model. Each checkbox enables one criterion. Disabled fields are ignored by the filter, so a filter can be broad or very specific depending on the batch workflow.
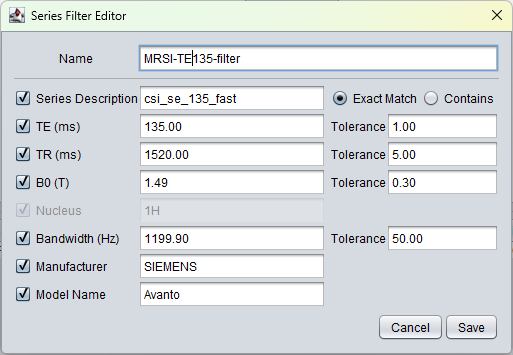
The display name of the filter. This name is used in the Processing Pipelines table when assigning the filter to a pipeline.
Filters on the DICOM Series Description text. Exact Match requires the full text to match; Contains accepts any series description that includes the entered text.
Filters by echo time in milliseconds. The tolerance defines how far the DICOM TE value may deviate from the entered value.
Filters by repetition time in milliseconds. The tolerance is useful when scanner-exported values differ slightly because of rounding or protocol variants.
Filters by main magnetic field strength in Tesla, for example 3T or 7T acquisitions. The tolerance controls the accepted deviation around the entered value.
Filters by spectroscopy nucleus, such as 1H. In
the current editor this criterion is shown as fixed to proton
spectroscopy.
Filters by spectral bandwidth in Hertz. The tolerance allows matching protocols that have nearly identical bandwidth but slightly different stored numeric values.
Filters by scanner manufacturer stored in the DICOM header, for example Siemens, Philips, or GE.
Filters by scanner model name. This can separate otherwise similar series acquired on different scanner models.
Press Add New in the Quantification Actions column to open the Quantification method window. For the current 64-bit workflow, TDFDFit is the active quantification method. spectrIm-QMRS preselects the default TDFDFit model that matches the currently loaded dataset, and displays both the model filename and the model directory.
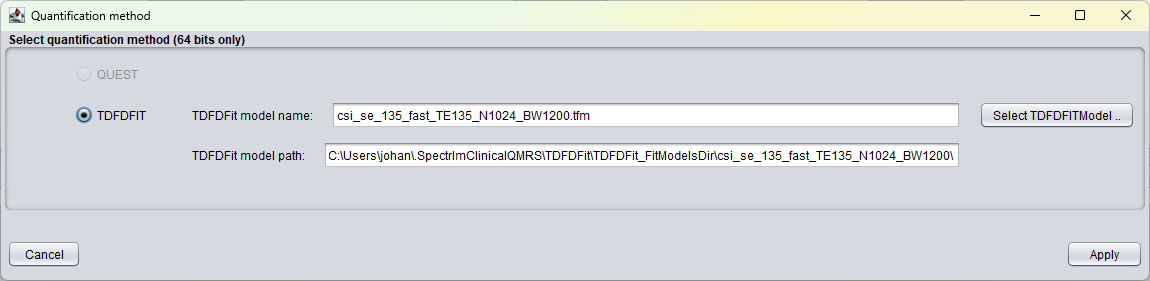
Deprecated jMRUI QUEST quantification option shown in the dialog. It is disabled in the current 64-bit workflow, will not be restored, and is planned for removal in the next major spectrIm-QMRS release.
Selects TDFDFit quantification for the action. This is the standard route for applying a predefined TDFDFit model to the preprocessed spectra.
Shows the selected model file, for example a model matching the current acquisition protocol, TE, bandwidth, and vector size.
Shows the directory where the selected model is stored. This helps verify that the pipeline will use the intended model collection.
Opens a model selector so the user can replace the default model with another TDFDFit model before saving the quantification action.
Saves the selected quantification method and model so the action can be assigned to a processing pipeline.
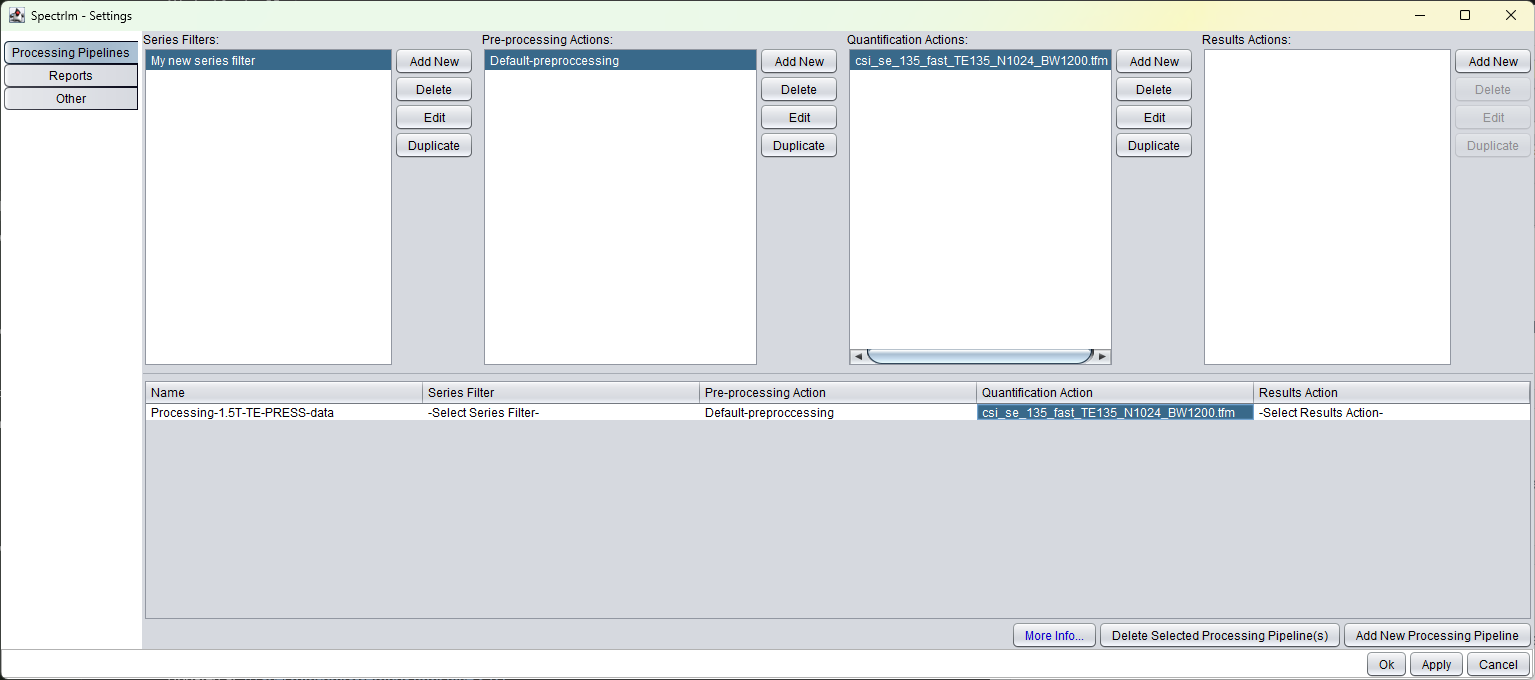
A complete processing action is assembled from up to four parts: a Series Filter, a Pre-processing Action, a Quantification Action, and a Results Action. The pipeline row defines which parts belong together and gives the complete action a name that can later be selected in the ClinicalViewer.
In this example, the processing action is named Processing-1.5T-TE135-PRESS-data. It contains Default-preprocessing and the selected TDFDFit quantification action. No Series Filter or Results Action is assigned in this example, so only preprocessing and quantification are part of the action.
After applying the Settings changes, the named processing action appears in the ClinicalViewer Processing Action selector. Select the action and press Process Data to run the configured pipeline on the currently loaded and selected spectra. The button is enabled only when the selected action is compatible with the loaded spectroscopy dataset.
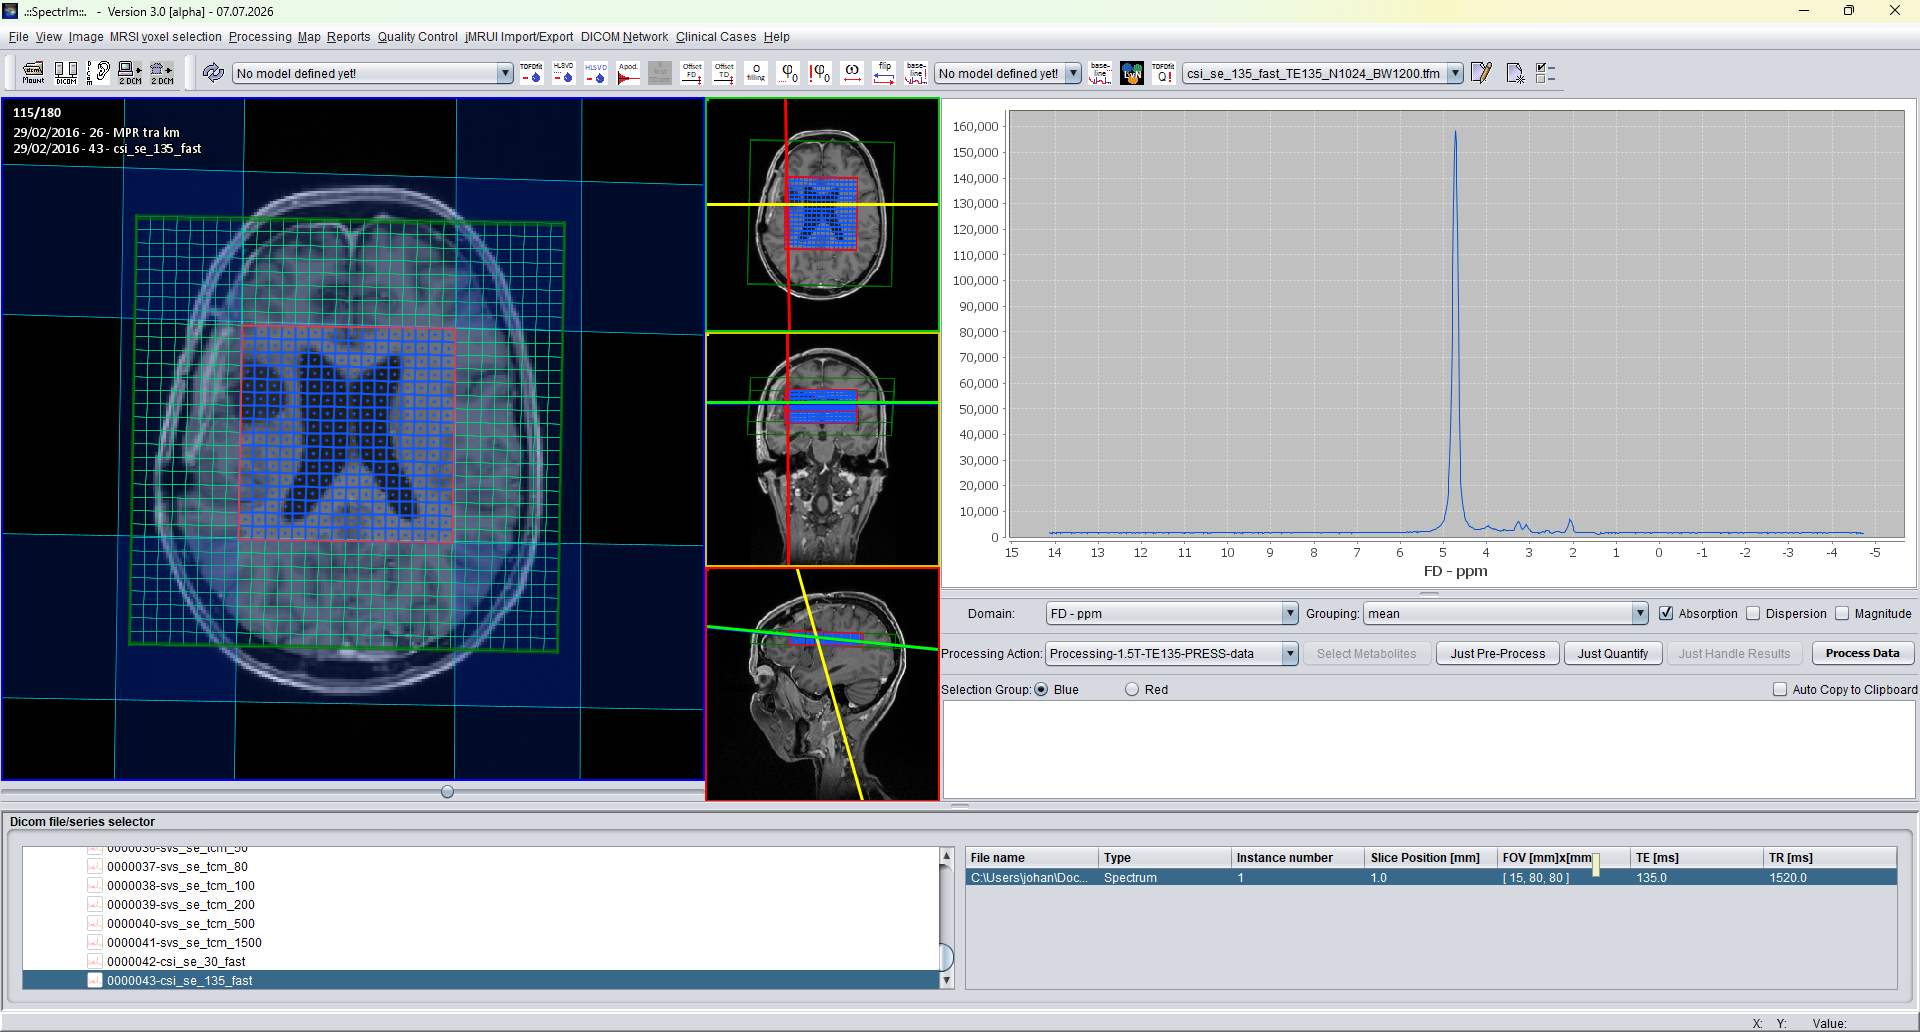
Whenever a spectroscopy dataset is loaded, or another Processing Action is selected, ClinicalViewer re-evaluates the action against the current spectrum. The Series Filter must match the loaded data, and TDFDFit quantification must match the relevant acquisition parameters, including TE, number of acquisition points, bandwidth, B0/resonance frequency, and ppm reference. If the check fails, Process Data is disabled and its tooltip explains the mismatch.
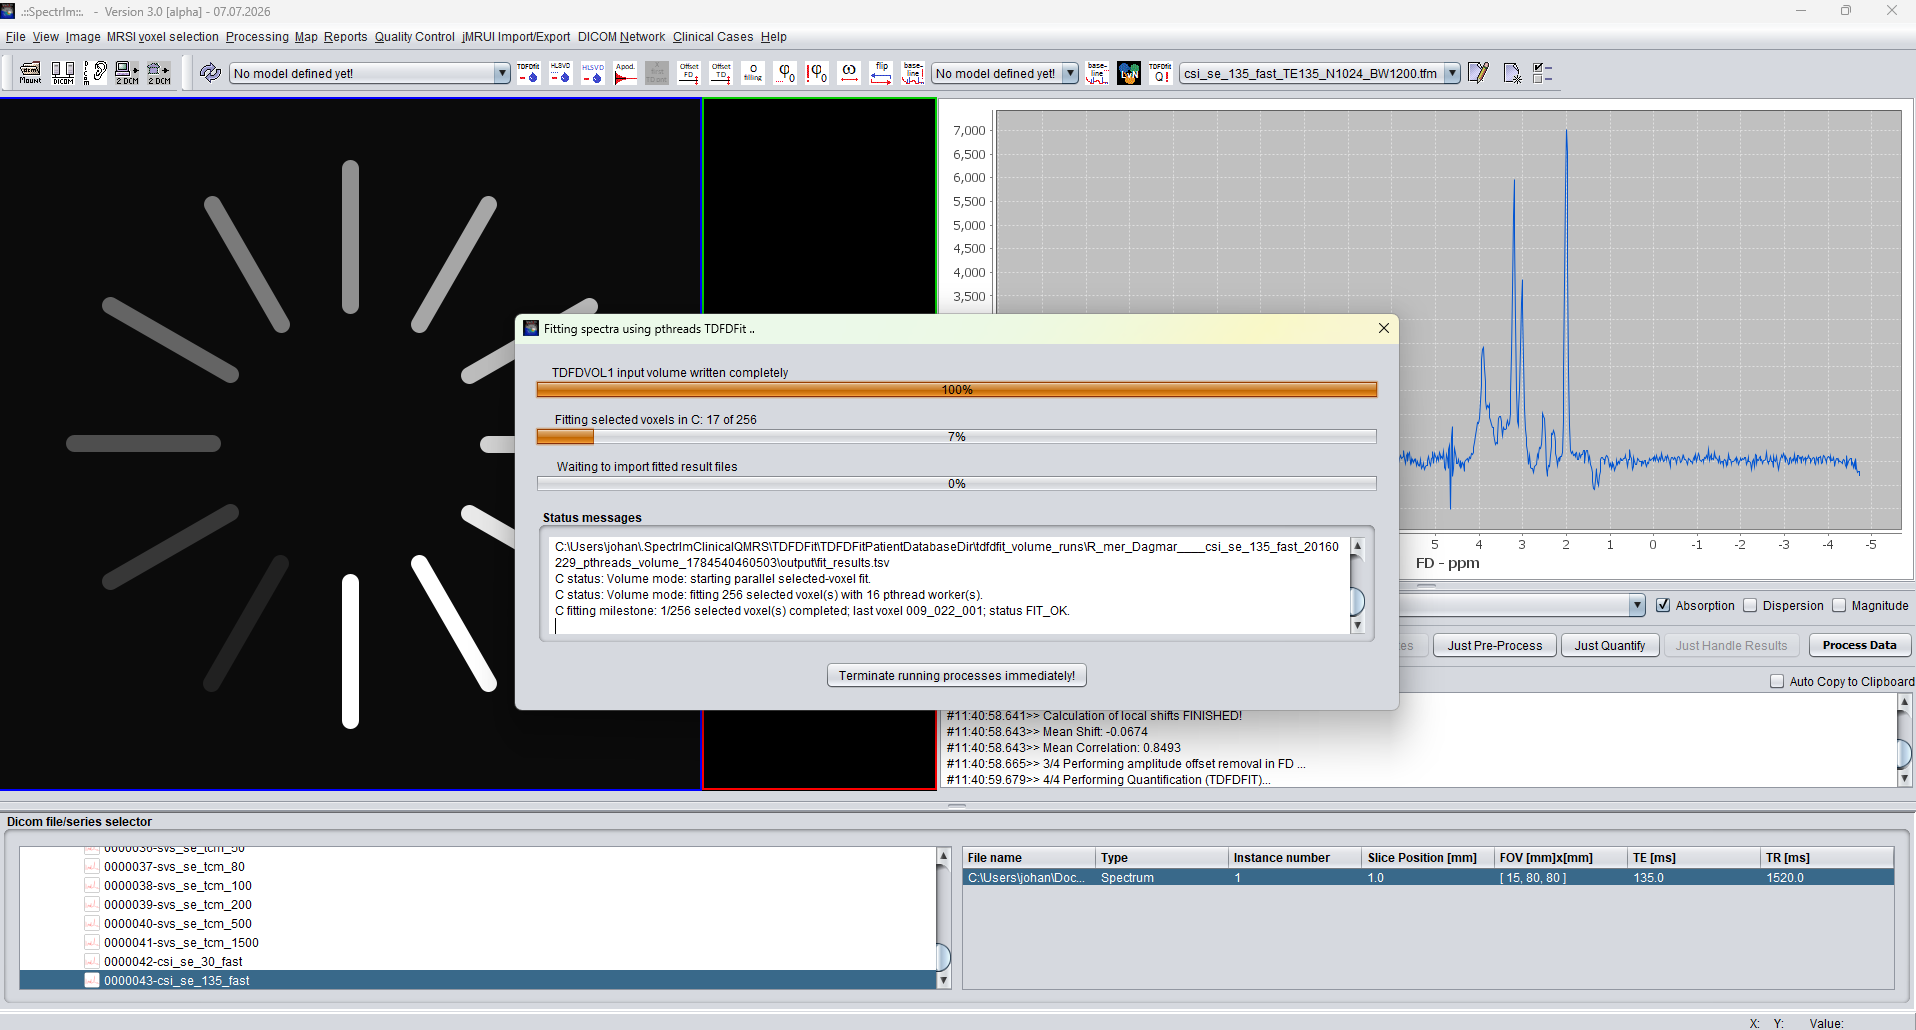
During a complete processing action, the default preprocessing steps run first: HLSVDPro water removal, frequency alignment, and adaptive frequency-domain offset correction. The workflow then continues with TDFDFit quantification of the selected voxels, with progress shown for writing the input volume, fitting, and importing the fitted result files.
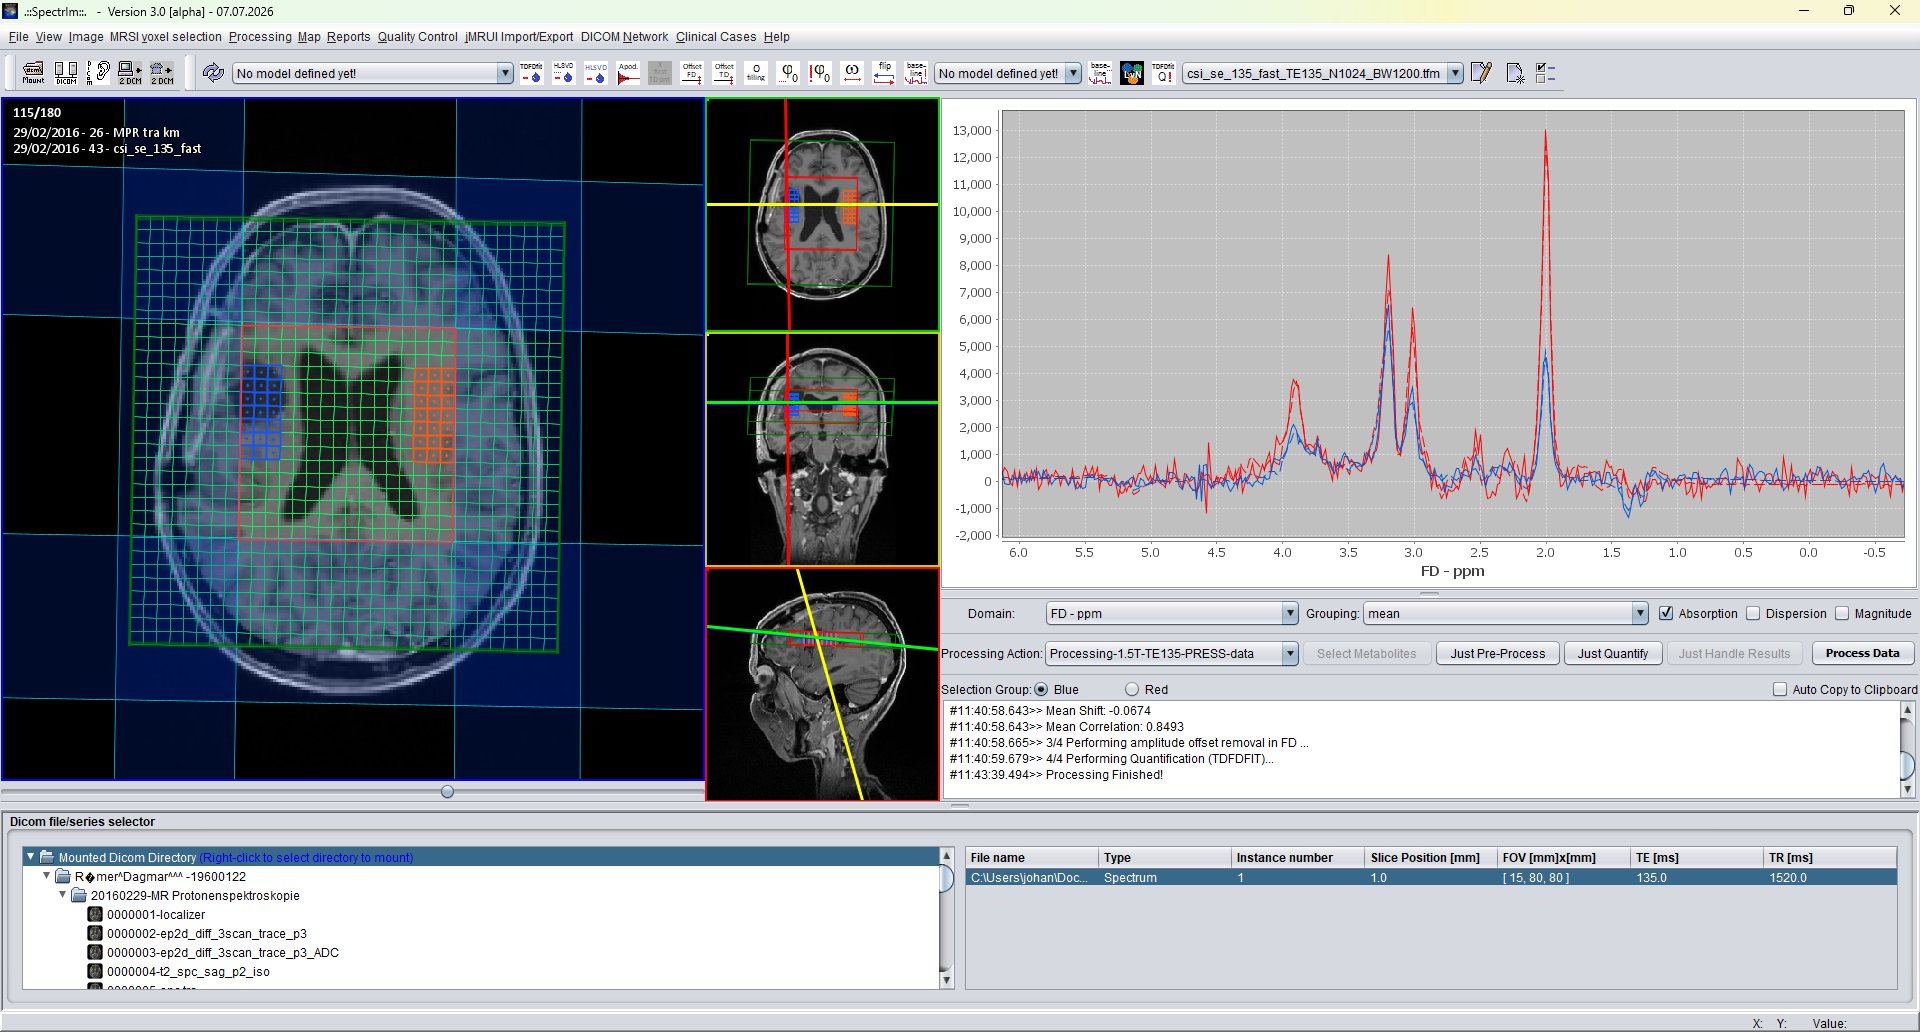
After processing has finished, the user can select voxels close to the lesion and press Ctrl + SPACE. The ClinicalViewer then shows the selected lesion-side spectra together with the mirrored opposite-side spectra, making it easier to compare abnormal tissue with a normal reference area. In this example, the tumor infiltration region shows elevated Cho/Cr and Cho/NAA ratios and lactate, consistent with increased metabolism and possible onset of necrosis.
Press Edit with Default-preprocessing selected to inspect the ordered preprocessing action. The default order is intentionally conservative: first remove the dominant residual water peak with HLSVDPro, then align spectra by frequency shift correction, then remove a constant amplitude offset in the frequency domain.
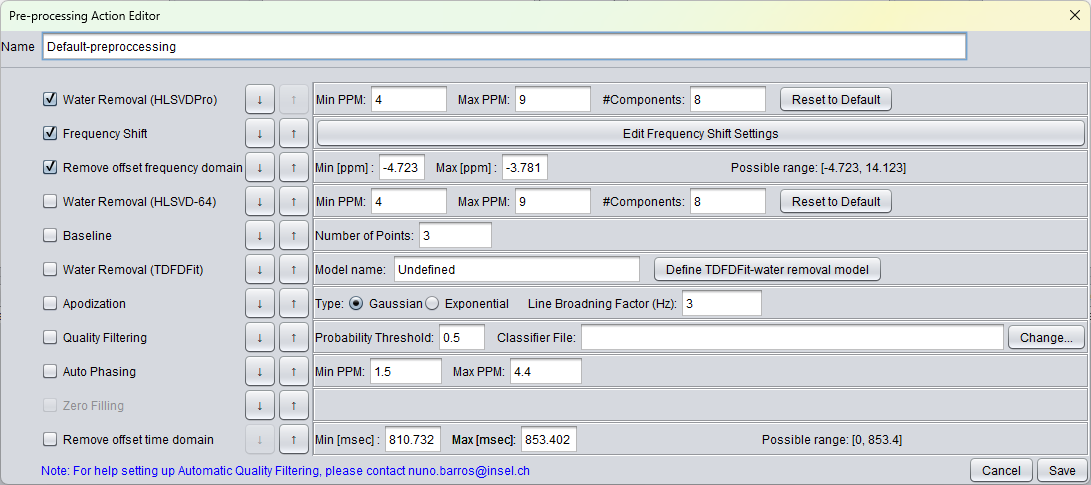
HLSVDPro removes the residual water component. The standard v3 setup uses HLSVDPro in parallel mode, so selected spectra are processed in batches instead of relying on the older serial-only route.
Frequency shift correction is used as frequency alignment. It detects reference peaks such as Cho and NAA and estimates a global and local shift for the selected spectra.
Frequency-domain offset removal estimates the average signal in a flat part of the spectrum and subtracts this value from the spectrum. This reduces a constant absorption and dispersion offset before quantification.
The FD offset range is adapted from the loaded spectrum. Since the ppm axis runs from high values on the left to low values on the right, spectrIm-QMRS uses the rightmost five percent of the available ppm range for the default action.
Select the processing action that contains Default-preprocessing, then press Just Pre-Process. This runs only the preprocessing part of the pipeline.
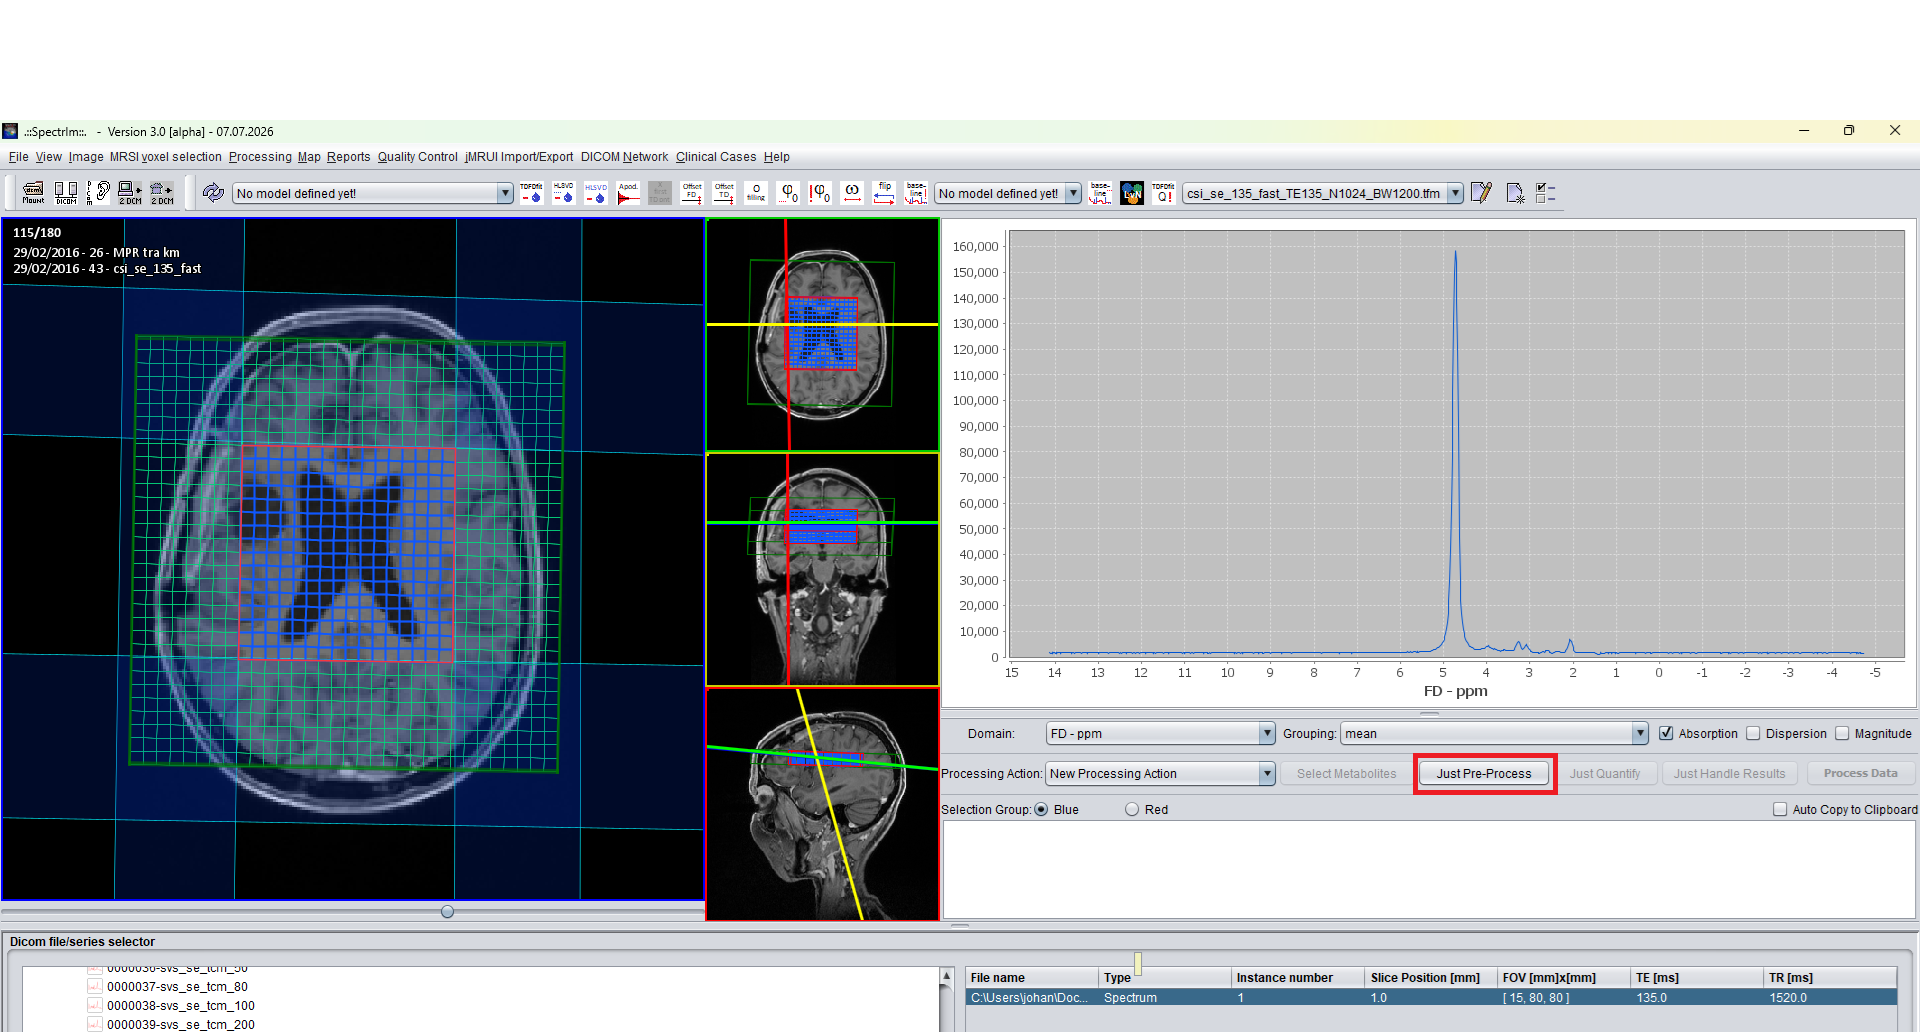
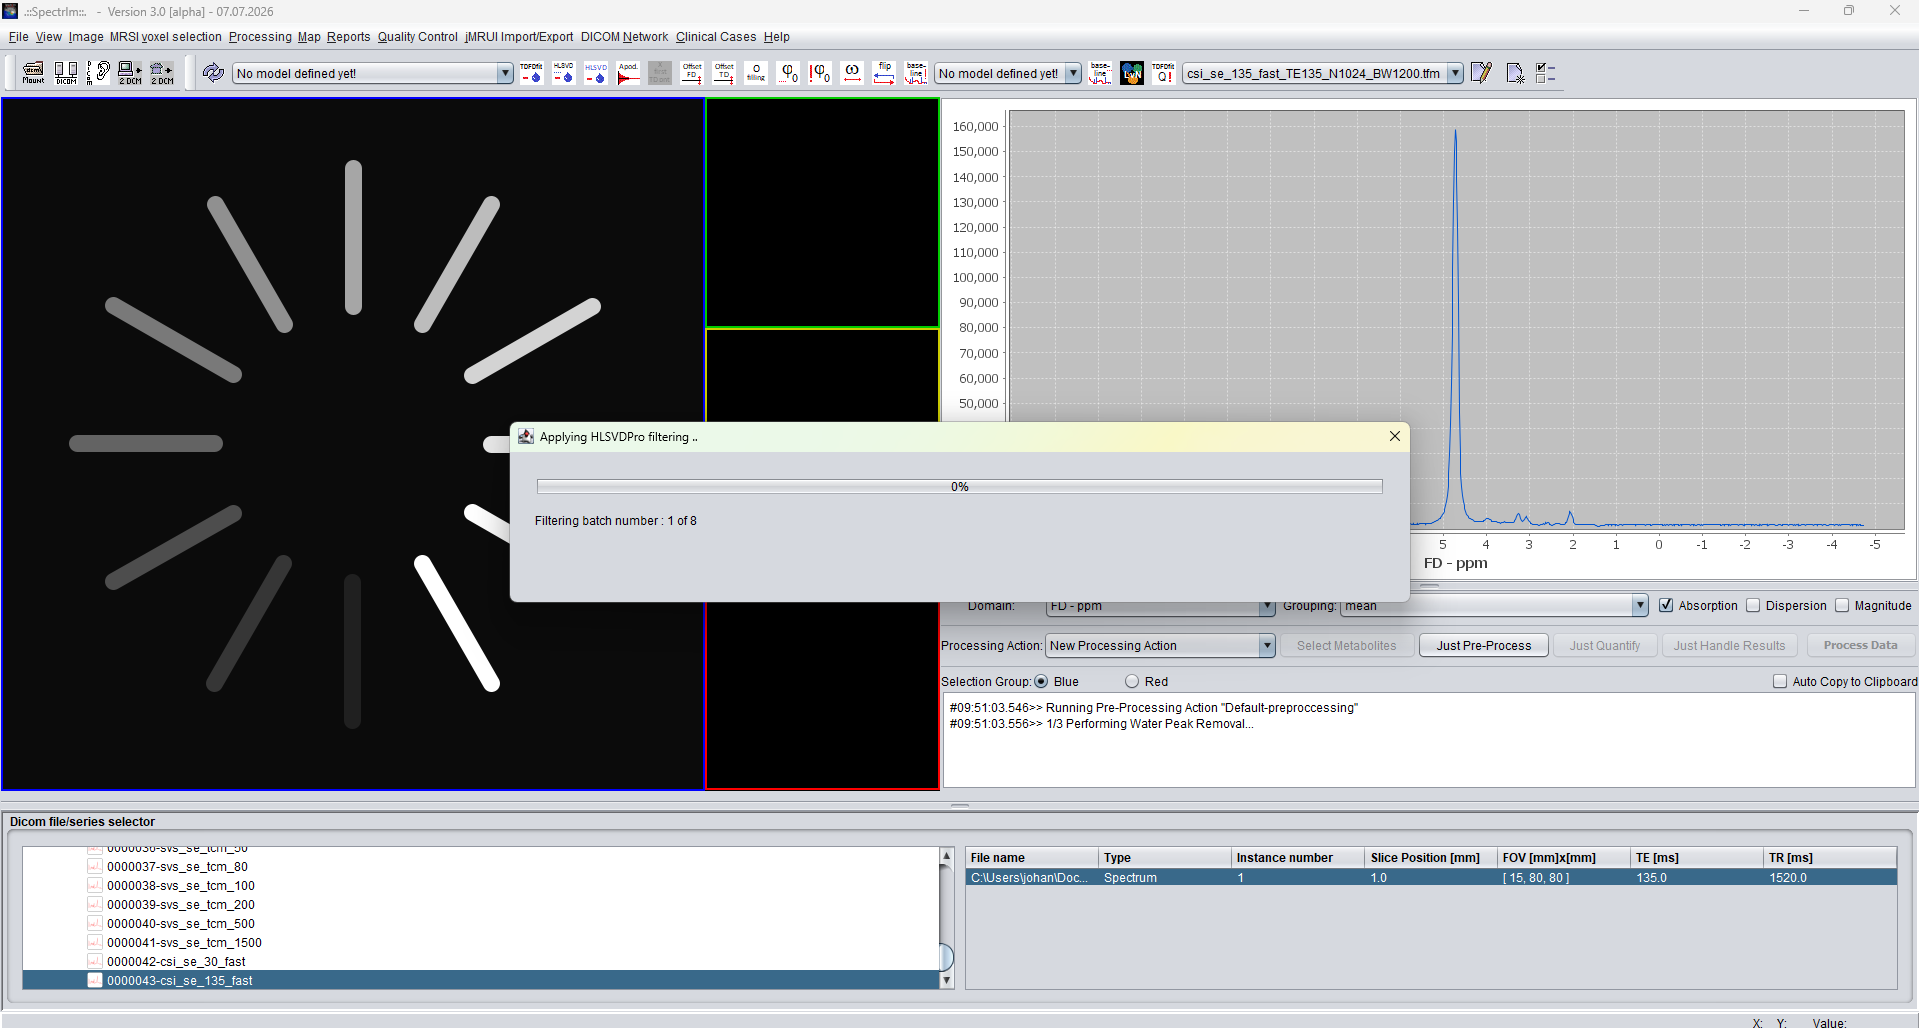
The output area reports the active preprocessing action and the current step. HLSVDPro water removal is performed first, followed by frequency alignment and FD offset removal.
After the three steps finish, the strong water peak is removed and the remaining metabolite region can be inspected in the spectrum display. The output area lists the completed steps.
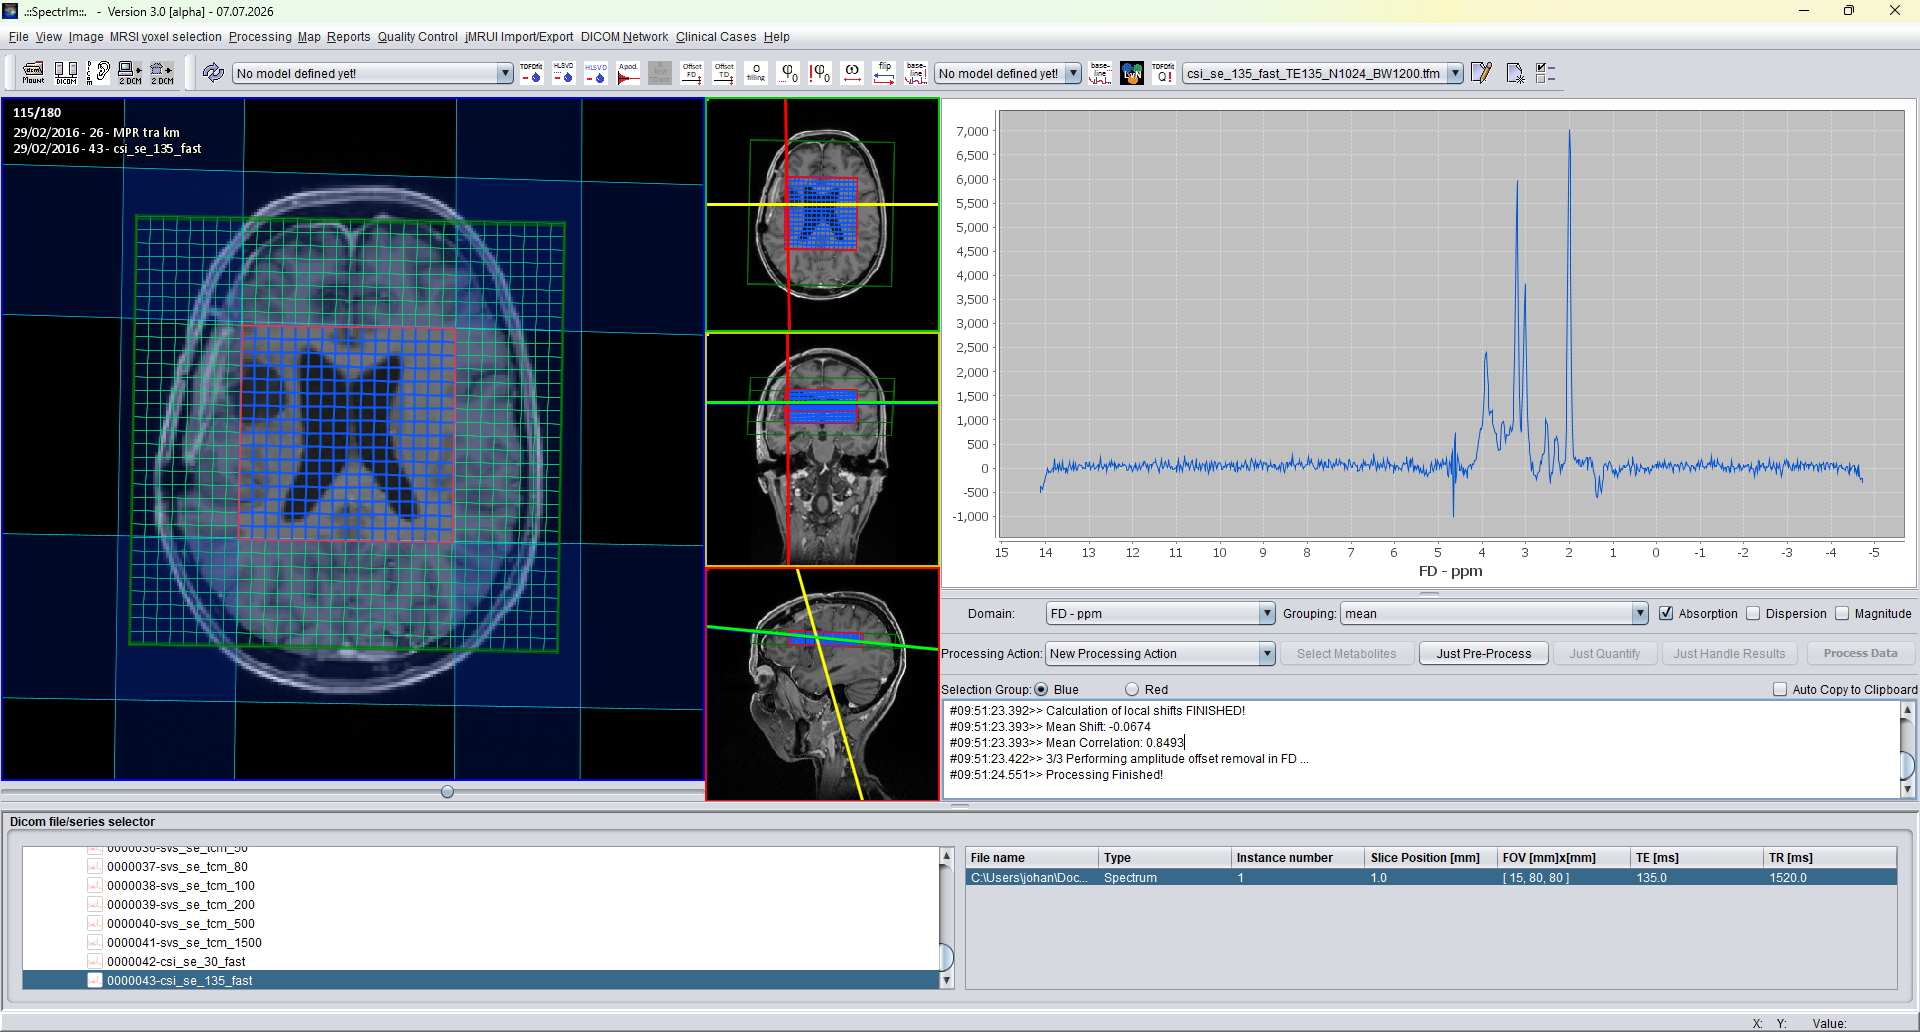
A typical run reports water peak removal, frequency shift correction with detected reference peaks and mean shift, and amplitude offset removal in the frequency domain. The final message confirms that preprocessing has finished.
The flat spectral region used for FD offset removal is not the same numerical ppm interval for every acquisition. A 7T dataset and a 3T dataset may expose different ppm limits, even though both should use a quiet region near the right side of the displayed ppm axis.
spectrIm-QMRS therefore reads the minimum and maximum ppm values from the loaded spectrum and updates the default preprocessing action automatically. When the Settings window is opened after a dataset is loaded, the editor shows the adapted values. When the action is executed, the values are refreshed again before the batch preprocessing commands are queued.
The File menu page documents where Settings is opened from and lists the neighbouring import/export commands.
HLSVDPro is the first default preprocessing step and is also documented as a water-removal and denoising component.
Continue with the broader workflow for preprocessing, quantification, and creating spectroscopic maps.
Use the spectrum display overview to interpret the before and after spectra shown during preprocessing.